

At Etna Interactive, we continually analyze millions of leads across hundreds of elective medical clinic locations. Included in this data set are clinics of the following specialties: Plastic surgery, facial plastic surgery, medical and cosmetic dermatology, ophthalmology, and medical spa. In this era of COVID-19, things are changing on a sometimes daily basis, and scrutinizing the data is more important than ever. In this series, we share tracked lead data, trends, and insights to help better equip you to sustain your practice through these challenging times. This post will be updated weekly with insights.
May 18, 2020
There it is! We did it! Lead volume has recovered to pre-pandemic rates for the week of May 11, 2020. Last week we saw a growth of 7.7% across all clinics and geographies, which brought the aggregate losses to -4.8%, which is odd to say. It means we can finally stop talking about total losses and talk about gains. This blog entry will likely be the last time we write about aggregate losses and pivot to how clinics are now gaining ground against their lead capture from early in the year. That is not to say that everyone is in the black now (more on that below), but rather, that our study will pivot from using positive numbers to describe “loss” to using positive numbers to express “growth” as we go forward.
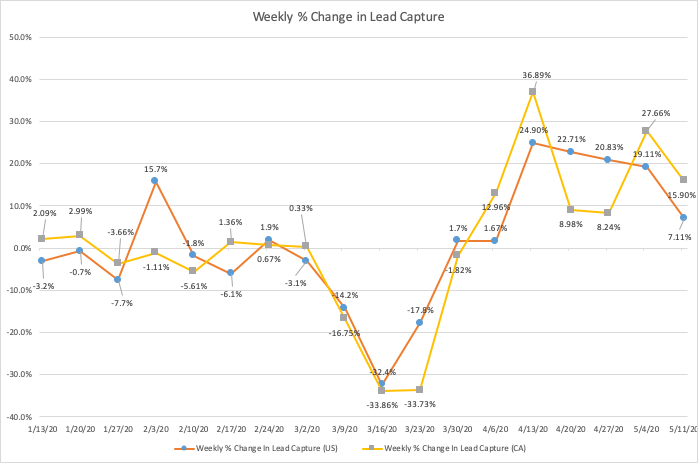
Weekly change in lead capture for medical marketing during the COVID-19 period.
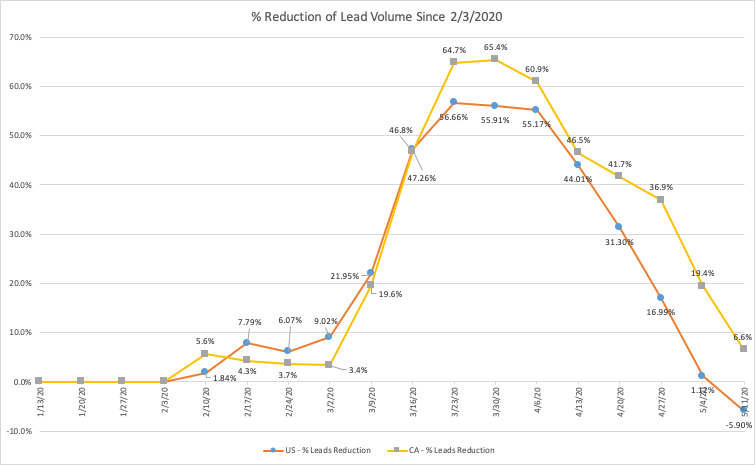
Aggregate loss in medical lead capture during the COVID-19 period.
Details
We are pleased this week to post another week of gains for U.S. and Canadian clients. Both countries saw increases in lead capture with Canada posting a 15.9% increase from the previous week while the U.S. growth slowed this past week to 7.1%. Previous weeks for the U.S. had been in the 20% range. We think this makes sense as Canada still has a little way to go to get their lead capture above the early February benchmarks, and the U.S. is already operating above seasonal norms as compared to the 2019 year. Effectively, the U.S. growth should slow to more “normal” behaviors after recovering strongly over the last 5 weeks.
With another week of growth under our belts, we have a split discussion week between the U.S. and Canda. Canadian clinics are still climbing out of the lead loss hole but should have their head above water this week. Their pre-pandemic losses have been whittled down to 6.6%. Etna’s U.S. clinics are now seeing a 5.9% growth over the February 3 benchmark.
Specific sectors are still experiencing slow recovery regardless of geography. Medical spa and ophthalmology practices are still underwater but continue to show week-by-week recovery. Ophthalmology clinics had a significant gain 2 weeks ago with a 15.4% increase in weekly lead volume but saw only a 5.4% increase the week of May 11. When compared to the benchmark of February 3, these clinics are still off by 15.4%. Medical spas, on the other hand, saw a slight increase 2 weeks ago with a 3.1% increase and a significant 19.7% increase this past week. However, medical spas are still down from the benchmark by 29.4%
We expect that next week both U.S. and Canadian aggregates will be in positive territories.
If your lead capture performance is not recovering at the rates we’re seeing, contact us to see what we can do for you.
May 11th, 2020
Back to where we began?
For 8 weeks now, we have been studying the lead capture trends for Etna clients to ask “Where are we?” concerning the pandemic. We pride ourselves on partnership—that means we need to be informed so we can help our clients make better decisions. This week we study the week of May 4, without references to Star Wars.
When we look at the aggregate trends on lead capture, for the first time in a long time it seems like the total lead capture is almost back to where we started (early February). Aggregate losses are sitting at 2.7% across all clients and geographies—nearly a return to normalcy.
As we dig into the data, we do see more variance by geography and practice type, which we will break down a little more. While the aggregate is almost back to where we started, there are still significant differences between U.S. and Canadian lead capture recovery rates.
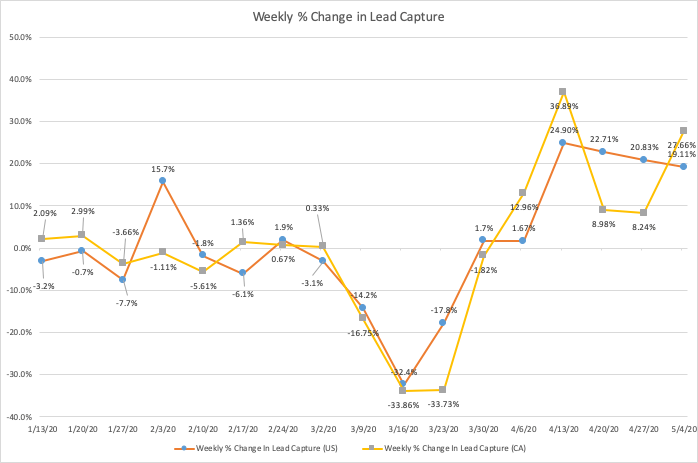
Weekly change in lead capture for medical marketing during the COVID-19 period.
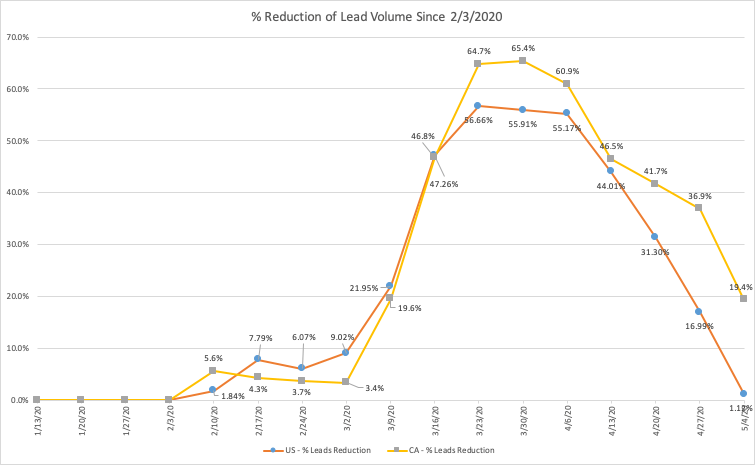
Aggregate loss in medical lead capture during the COVID-19 period.
Details
Canadian consumers are still lagging behind U.S. consumers in their inclination to schedule consultations and appointments. However, this past week saw a significant increase in that consumer volume from previous weeks. Canadian aggregate losses compared to the beginning of the study (February 3) are now under 20% (19.4% to be precise). A 27.7% weekly increase in lead volume for those clinics is a welcome relief, but there is still quite some way to go.
In the U.S., we saw another almost 20% weekly increase in lead capture at 19.1%, which brings the aggregate loss from February 3 to 1.1%. That’s 4 weeks in a row of lead increases in the range of 20%. We have heard that many clinics are now booked out well through the summer, particularly when taking into account the extra precautions for COVID-19 that tend to slow down office visits and surgical timing for enhanced cleaning and social distancing.
Consumer demand for elective medicine is still there and is now expressing itself strongly.
When we examine different practice types, we still see challenges with medical spas. Across that client cohort, lead volumes are still far off from pre-pandemic highs by about 40%. These practices are experiencing more phone leads, but their total amount has not seen the rebound that surgical clinics have seen.
When we break down this group to look for any reason for their slower growth, we find that there does not seem to be a correlation between the relaxation of shelter in place orders and lead volume increase. There does seem to be a correlation between COVID-19 and virtual consultation messaging and growth. Med spa practices that had more prominent messaging about their changes to internal practices due to COVID-19 and who had a virtual consultation message saw faster lead capture rebounds (see www.rejuvclinic.com). More than 60% of them are now on par with early February or beyond at this time.
There are probably behavioral differences in the consumers for these practices that are driving the lead recovery as well. We know that there are demographic variances in med spa and surgical clinics, so we can’t rule those out in this review.
Summary
We know that this period has been hard on many consumers and businesses. Not all companies will recover from it for quite some time, if at all. However, almost 50% of Etna clients have gotten to a recover point, from a lead capture perspective.
The breakdown of client lead capture loss or growth, as compared to the week of February 3, by quartile follows:
- 49.3% of clients saw increases in weekly lead capture
- 20.1% of clients decreased by between 0 and 25%
- 14.6% of clients decreased by between 25% and 50%
- 11.8% of clients decreased by between 50% and 75%
- 4.2% of clients decreased by between 75% and 100%
May 4th, 2020
Weekly Growth Slows for Canada, Holds in the U.S.
We continue to see lead capture improvements across the client base. However, recent weeks have seen a slow-down in the rate of increase for Canadian clients, while U.S. clients continue to see consistent increases in lead volume.
For the current study week, April 27, the U.S. has seen another 20+% improvement in lead capture while Canada saw only an 8.24% increase. That is 3 weeks in a row of U.S. lead performance improvements in the 20% range.
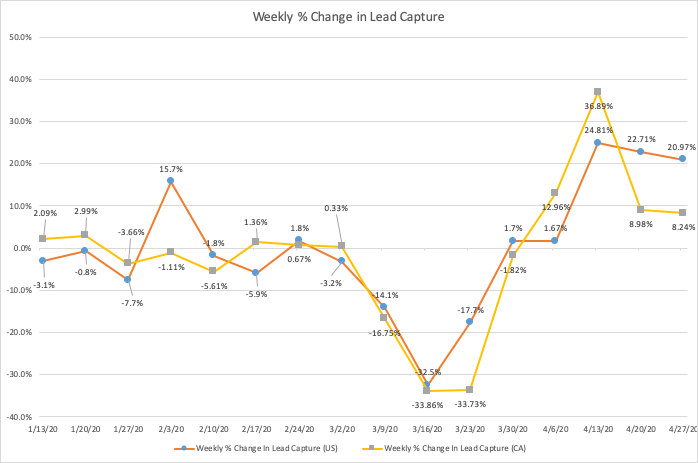
Weekly change in lead capture for medical marketing during the COVID-19 period.
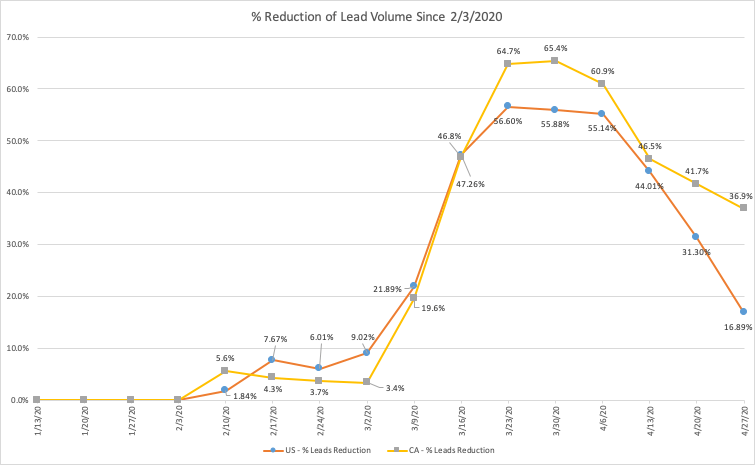
Aggregate loss in medical lead capture during the COVID-19 period.
Details
When we look across the client base to try and determine how far the lead recovery has come and how far it has to go, we find that the disparity between U.S. and Canadian clients is getting bigger. This week we observe the aggregate loss of lead volume since the peak of this year has come under 40% for the first time in 7 weeks in Canada. For U.S. clients, the aggregate loss is at 16.9%.
While Canadian consumers seemed slower to react to the decline in February, they are also more reluctant to respond now. Canadian aggregate losses are still over 30%, at 36.9% this week. This includes a week-to-week increase of 8.2% in Canada versus 21% in the U.S.
When we break down clients by cohort, we find the following groupings:
- 36.8% of clients now see an increase in weekly lead capture since the week of February 3, 2020.
- 17.4% of clients decreased by between 0 and 25%
- 25.7% of clients decreased by between 25% and 50%
- 13.2% of clients decreased by between 50% and 75%
- 6.9% of clients decreased by between 75% and 100%
The differences we have observed by state and by practice type in previous weeks still hold. States like AZ, CO, CT, HI, KY, OH, TN, TX all posted gains greater than 20% over their early February lead capture counts. Meaning these states captured more leads in the most recent week than they did in the peak reference week of February 3rd.
Ophthalmology offices are still experiencing the most significant loss when evaluating performance by practice type. While they had a significant gain this week (44%), they are still down 30.4% from the peak of the year.
Many of our clients have begun the pivot to reopening and recovery communications. Returning patients will need more marketing to help them understand how the process of visiting a clinic has changed. New customers need help navigating from their early awareness into decisions now that they can get more time with a clinic. If you would like help with any of this, make sure to reference Etna’s recent blog posts.
April 27, 2020
Another Week of Growth
We saw more lead capture growth across the board for the week of April 20, with an almost 20% increase in lead volume this week across all practice types.
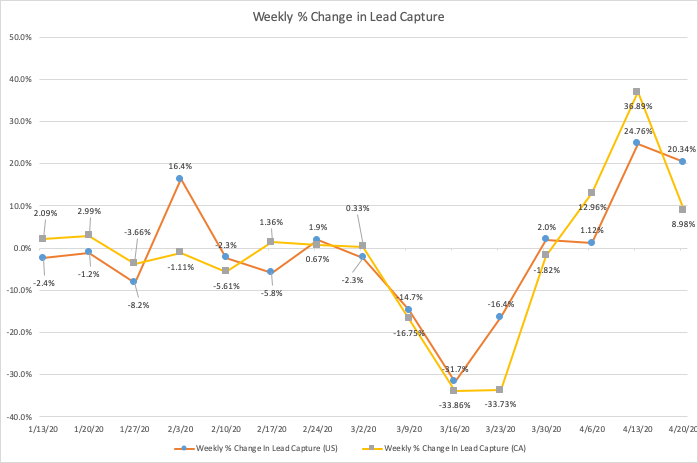
Weekly change in lead capture for medical marketing during the COVID-19 period.
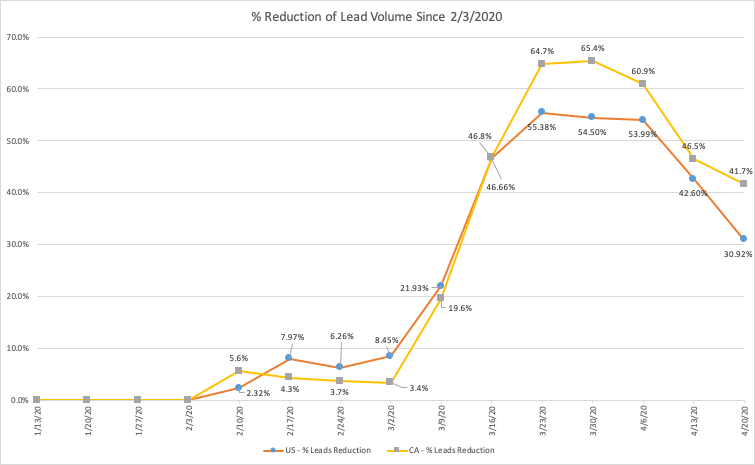
Aggregate loss in medical lead capture during the COVID-19 period.
The Details
Growth in the U.S. continued to outpace lead growth in Canada. Canadian clients saw only an 8.9% change in lead capture volume compared to last week, while U.S. clients experienced a 20.3% increase. Last week it looked like the gap between U.S. and Canadian lead capture losses since February 3 was starting to close, but not any longer. Weekly gains have created a more significant split in recovery when looking at aggregate losses since the peak of the year. The U.S. aggregate losses are now at 30.9%, and Canada’s are still in the forties (41.7%).
We chose to look at differences by practice type this week to see if there are any interesting behaviors there. As you would expect, the practice types that have shown consistent week-over-week gains are now reporting the lowest aggregate losses. Dermatology practices have recovered the most since February of this year and now show only a 20.7% aggregate loss. On the downside, ophthalmology offices are still experiencing more than 51% aggregate losses and have seen only 3% week-over-week gains for the last 2 weeks.
Recovery is still gaining momentum, and we expect to see more of that in the coming weeks as more states change their shelter-in-place guidance and permissible business operations. Some states have begun to allow elective and cosmetic surgeries at the beginning of May. The momentum is currently on the side of recovery and coming out of “lockdown.” Etna Interactive is urging our clients to prepare their re-opening messaging, so consumers know what to expect. Shelter in place may be different now, but social distancing is still in effect.
April 20, 2020
Another Week of Gains With Higher Regional Variance
Another week into this study, and we see more gains in client lead volume, which reinforces our stance that recovery of lead volume is on the way. This week, in addition to the aggregate research of lead volume across the U.S. and Canada, we reached out to some peers in the medical marketing space to help validate our data.
The high-level change for lead volume, the week of April 13, is +25% for the week-over-week, which brings the aggregate loss up to 42.9% since February 3, 2020.
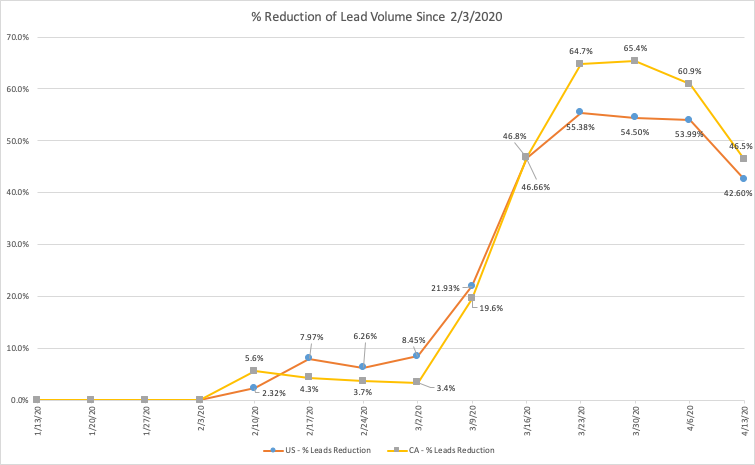
Aggregate lead reduction rates for U.S. and Canadian clients during COVID-19 period.
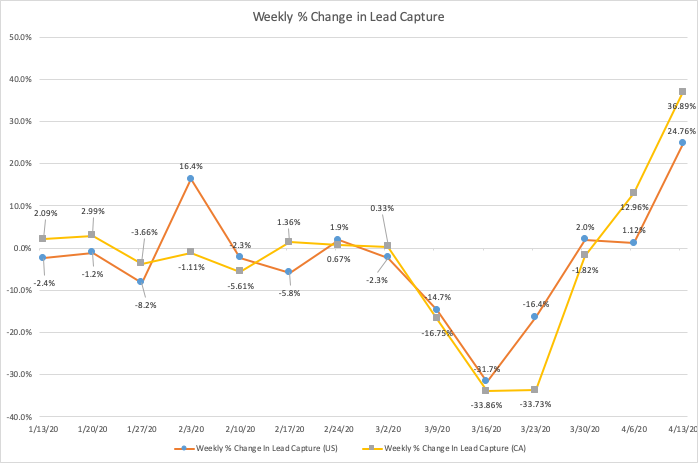
Week by week lead volume changes in U.S. and Canada during COVID-19 period.
The Details
A solid growth week with 25.6% more leads than the previous week, we did see a growing variance between the U.S. and Canadian lead volumes. U.S. clients saw 24.8% more leads this week while Canadian clients surpassed that with 36.9% growth. This week brings the losses for the U.S. since February 3 to 42.6%, with Canada closing the gap to 46.5%.
We started to see a great deal more regional variation between the accounts with growth, those with neutral movement, and those with continued losses. Shutdowns and infection rates have a great variance county to county and province to province. However, the spread appears to be getting larger when looking at the increases by quartile.
- 24.1% of clients saw increases in weekly lead capture
- 12.4% of clients decreased by between 0 and 25%
- 29.7% of clients decreased by between 25% and 50%
- 21.4% of clients decreased by between 50% and 75%
- 12.4% of clients decreased by between 75% and 100%
We reached out to our friend Enrique Rangel, CEO of MyMedLeads, to explore how our data compares to their own. As we explore the data sets, we noticed the same trends operating around the same periods. While the magnitude of lead loss for the Etna data set is a little higher (56.2%) than the MML data set (50.2%) the curves, themselves are almost identical.
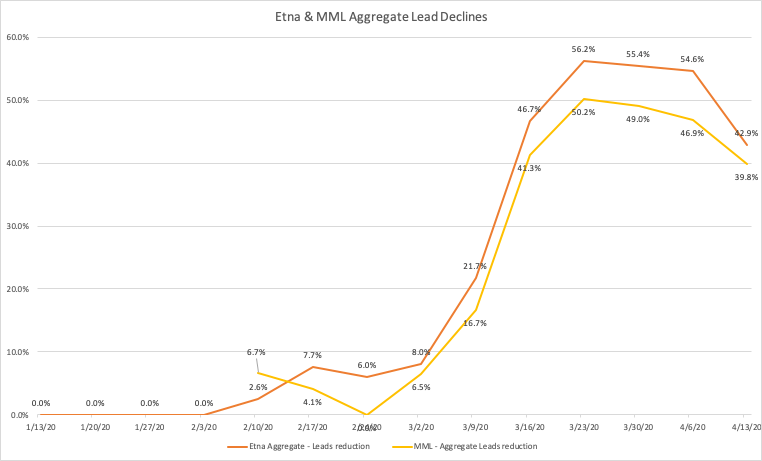
Lead reduction rates for Etna and MyMedLeads clients compared.
This led us to ask, “Why are consumers increasingly creating leads now?” Most states are still in some form of shut down; the number of infected individuals is still climbing in many areas of North America; layoffs and financial hardship are on the rise. We think there are 2 main contributors to this increase in lead volume:
- Recovery is in sight – The general public is starting to feel an end to shelter-in-place advice and a reduction in the overall risk of infections. There is also an undercurrent of anxiousness to return to some normalcy.
- Consumers are more comfortable with virtual tools – With more people communicating via virtual tools (Facetime, Skype, Zoom) at the personal and professional levels, their comfort with participating in virtual consultations increases. They may have utilized some telemedicine features or watched newscasts all performed over virtual tooling.
These trends are combining to account for some of the growth we see. We are still far below the high for the year, and we are coming out faster than we thought previously. If this rate holds, lead capture rates could be back to seasonal norms within 4 weeks.
April 13, 2020
Another Flat Week; How Long Will We Be Here?
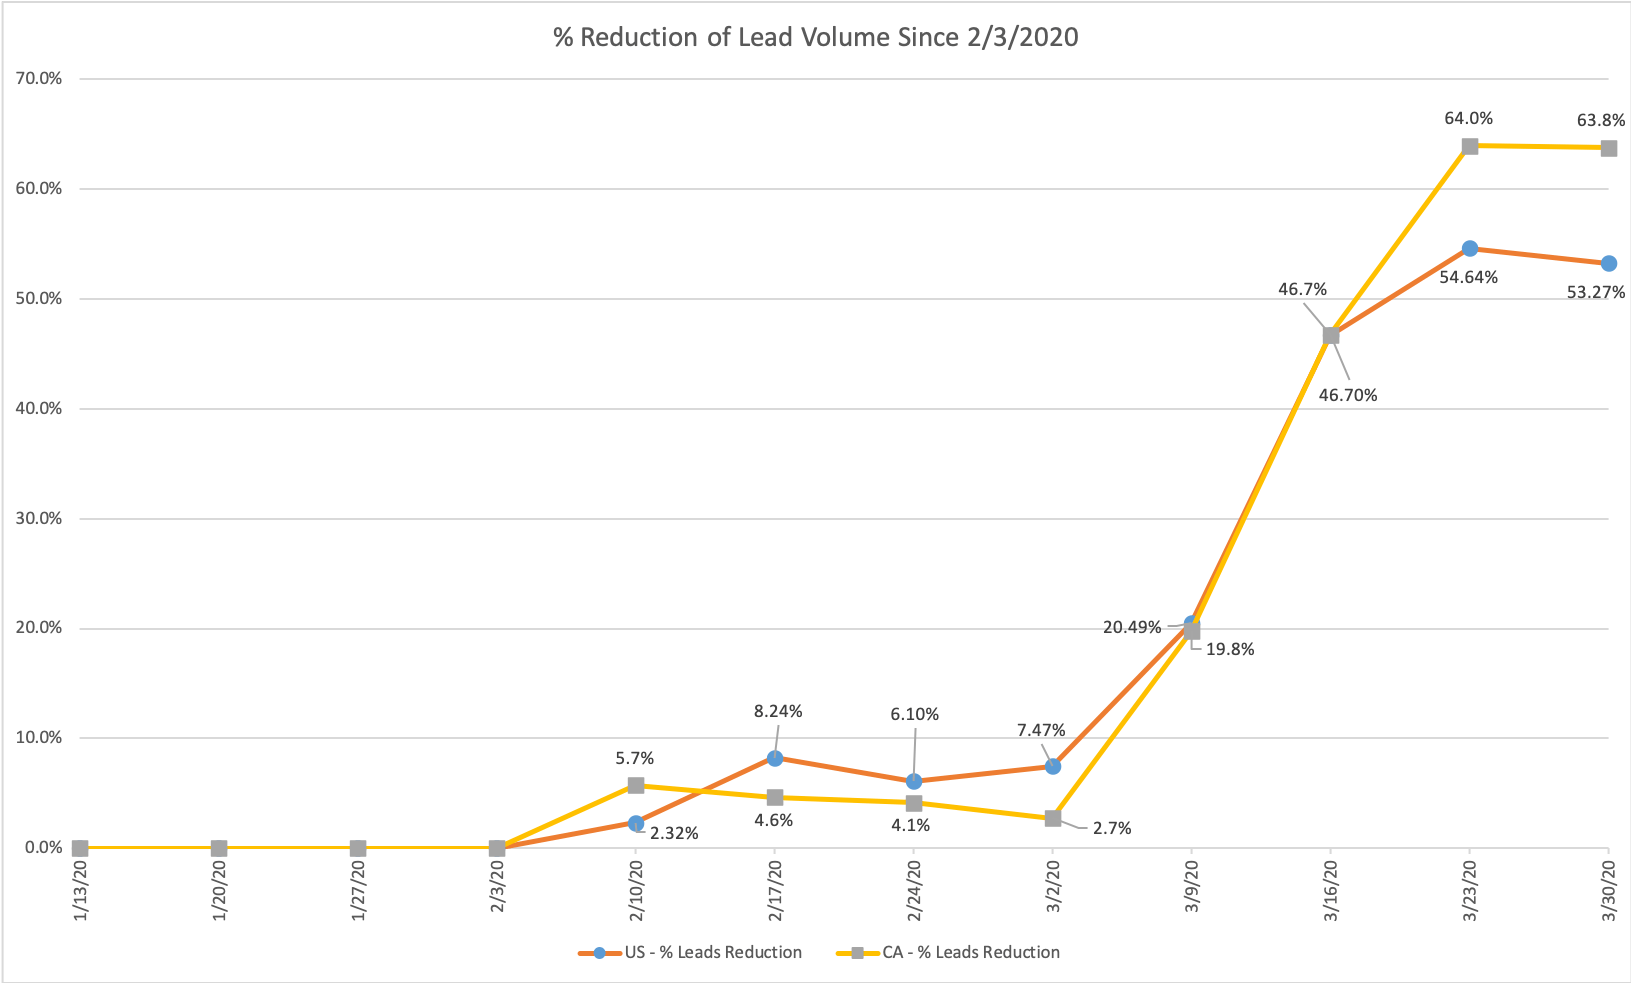
Another week passes, and we look deeper into the data to try and understand the trends and specific client performance that guides our medical marketing strategy. This was a relatively flat week showing limited gains on the losses from earlier in February and March. With the Etna aggregate client lead volume loss still hovering around 54.6%, at large, lead performance is doing what we expected. We have continued the breakdown of U.S. and Canadian performance below but also applied several data corrections to past week’s numbers where we found erroneous values.
Details
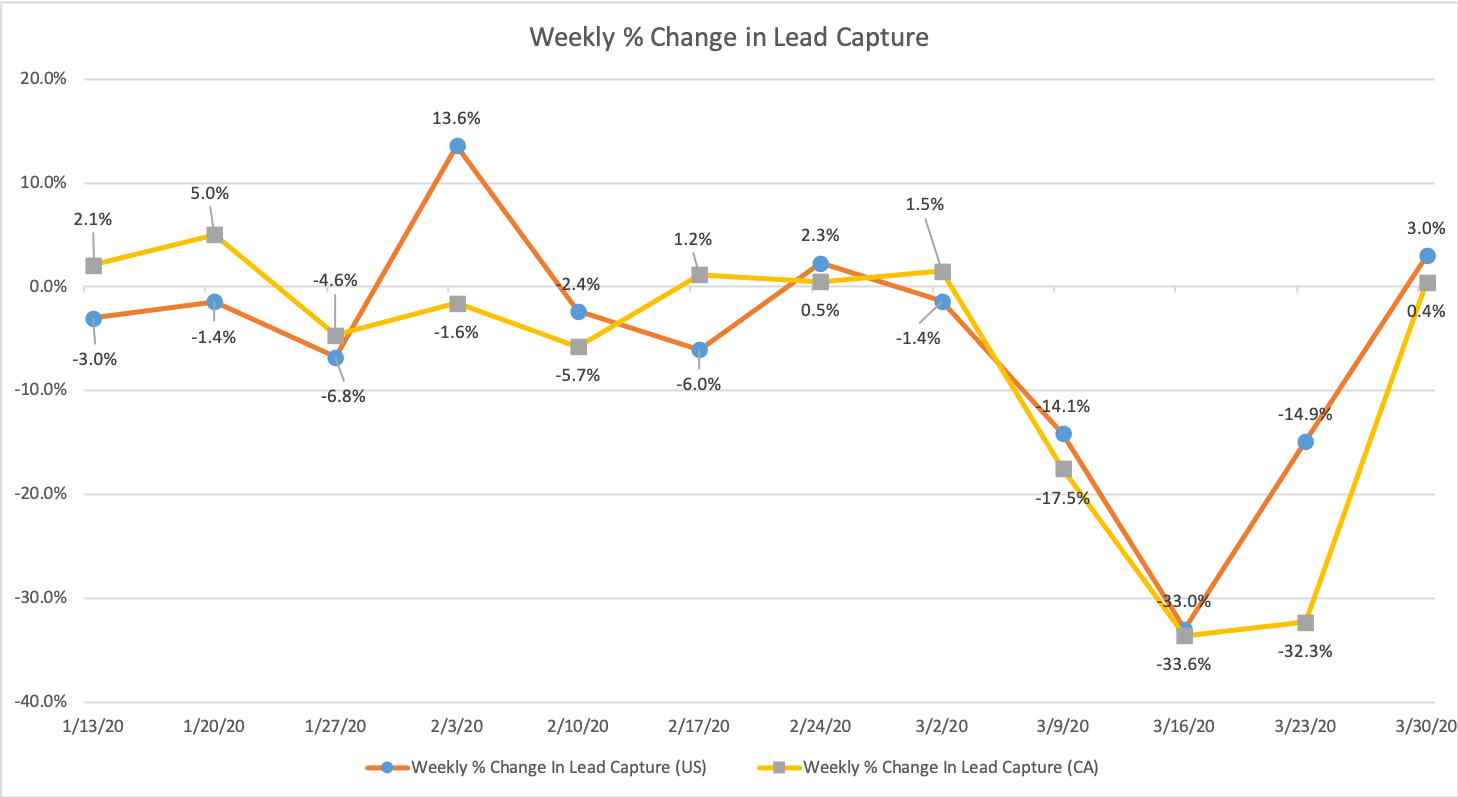
The weekly trend across all Etna clients shows modest gains in lead capture of 1.91% for the week of April 6, 2020. While the U.S. showed only 1.12%, Canada posted a more substantial 13% week over week improvement. Weekly lead gain brings Canada into positive territory after 4 weeks of negatives.
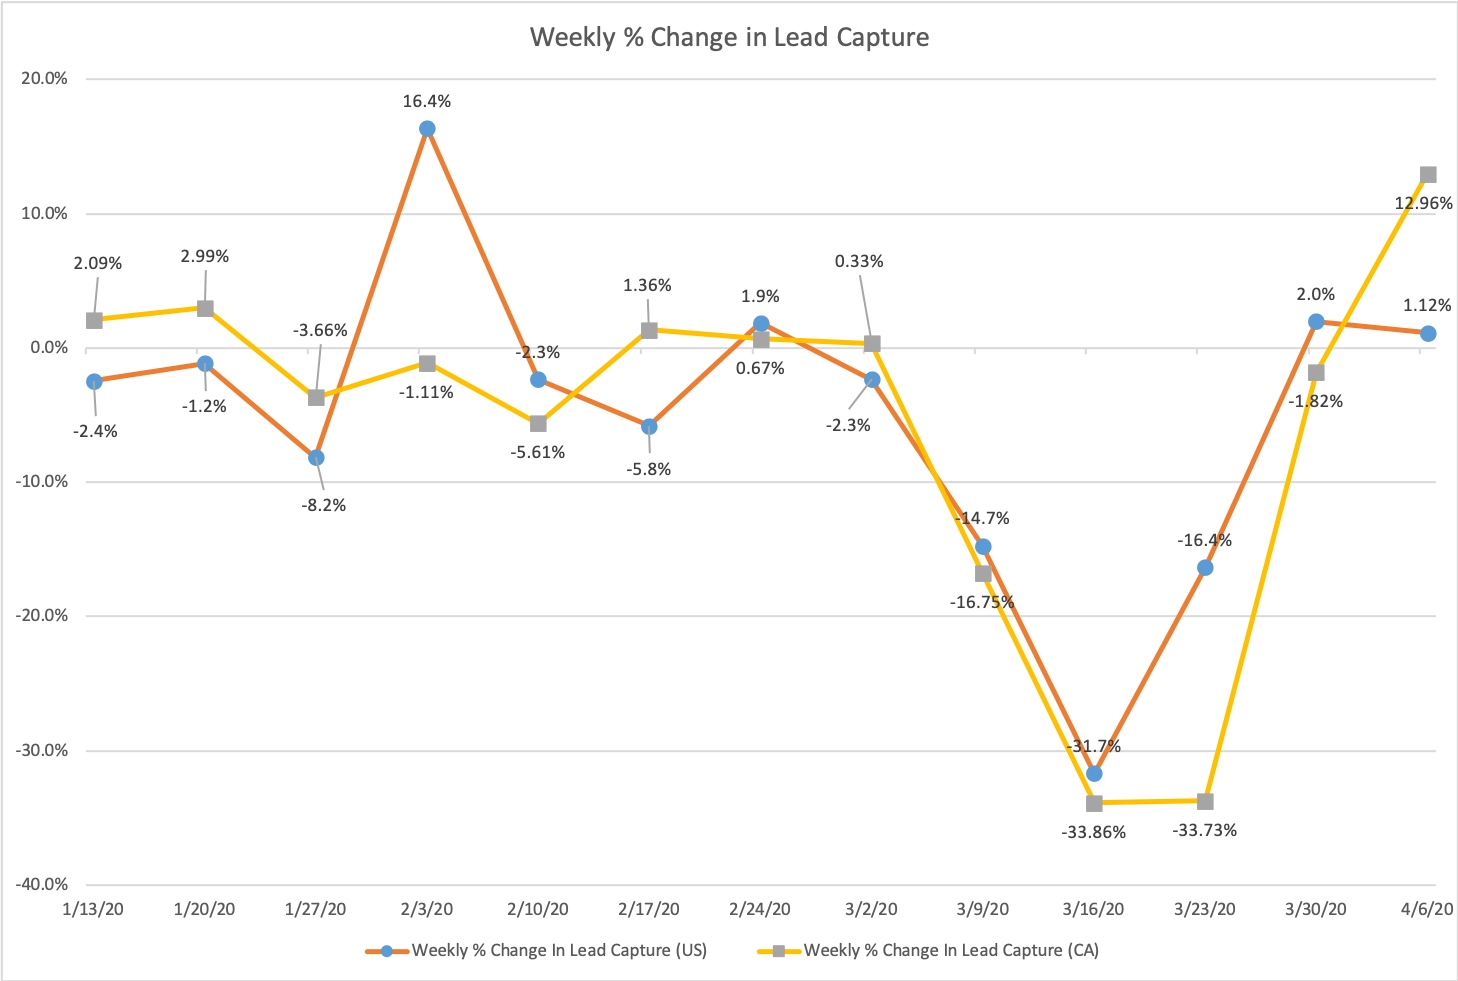
Weekly change in lead capture rates for Etna clients during COVID-19 period.
When we study total lead volume losses since our benchmark week of February 3, 2020, we see that the U.S. holds the line at 54%, and Canada makes some improvement to 61%.
Weekly cumulative losses in weekly lead collection for medical marketing clients.
In our distribution of where clients land, we see the following. Note that we have corrected some data in our core set, which was skewing our analysis. While this correction has not changed any of the trends we have seen over the past weeks, it does alter the absolute position in which quartile specific clients exist.
The total percentage of clients who have now seen a less than 50% reduction in lead capture volume has increased again this week.
- 10.7% of clients saw increases in weekly lead capture
- 9.08% of clients decreased by between 0 and 25%
- 23.8% of clients decreased by 25% and 50%
- 33.6% of clients decreased by 50% and 75%
- 22.1% of clients decreased by 75% and 100%
We dug a little further into March 2020 data to see if we could learn more compared to the previous month (February 2020) and the past year (March 2019). While we know that March 2020 was down much more than March 2019 and February 2020, some interesting patterns formed when looking at year-over-year and month-over-month performance.
First, the second and third weeks of March in 2020 and in 2019 were both down weeks. Meaning those weeks in both years were lower than the first week of March. In 2019 the second week of March (starting 3/11/19) showed declines of 15.%, while in March of 2020, we saw declines of 14.7%. The third week of March 2019 saw further losses of 10.7%, while March of 2020 shows the much steeper decline of 31.7%. It seems that some of the weekly trends for the second week of March 2020, could be seasonally oriented as well as pandemic influenced.
We looked at month-over-month (MoM) performance for February compared to March in both 2019 and 2020. In MoM 2019 (February over March), we saw a 10.3% gain in lead capture. But, for the same period in 2020, we saw an 18.6% loss.
What Does It Mean?
This data reinforces our view that, given the current state of medical marketing and pandemic effects, we are at the bottom of the losses. The next question we want to answer is, “When will we come out?” Current trends in 4 key metrics (infection rates, death rates, testing rates, and public sentiment) lead us to think we will be in this rut of low lead capture for another 5 weeks. After that time, we believe that lead capture rates will improve. Changes to any of those key 4 indicators will change the path of recovery and our horizon of improvement.
April 6, 2020
Lead Decline Flattens. Have We Hit the Bottom?
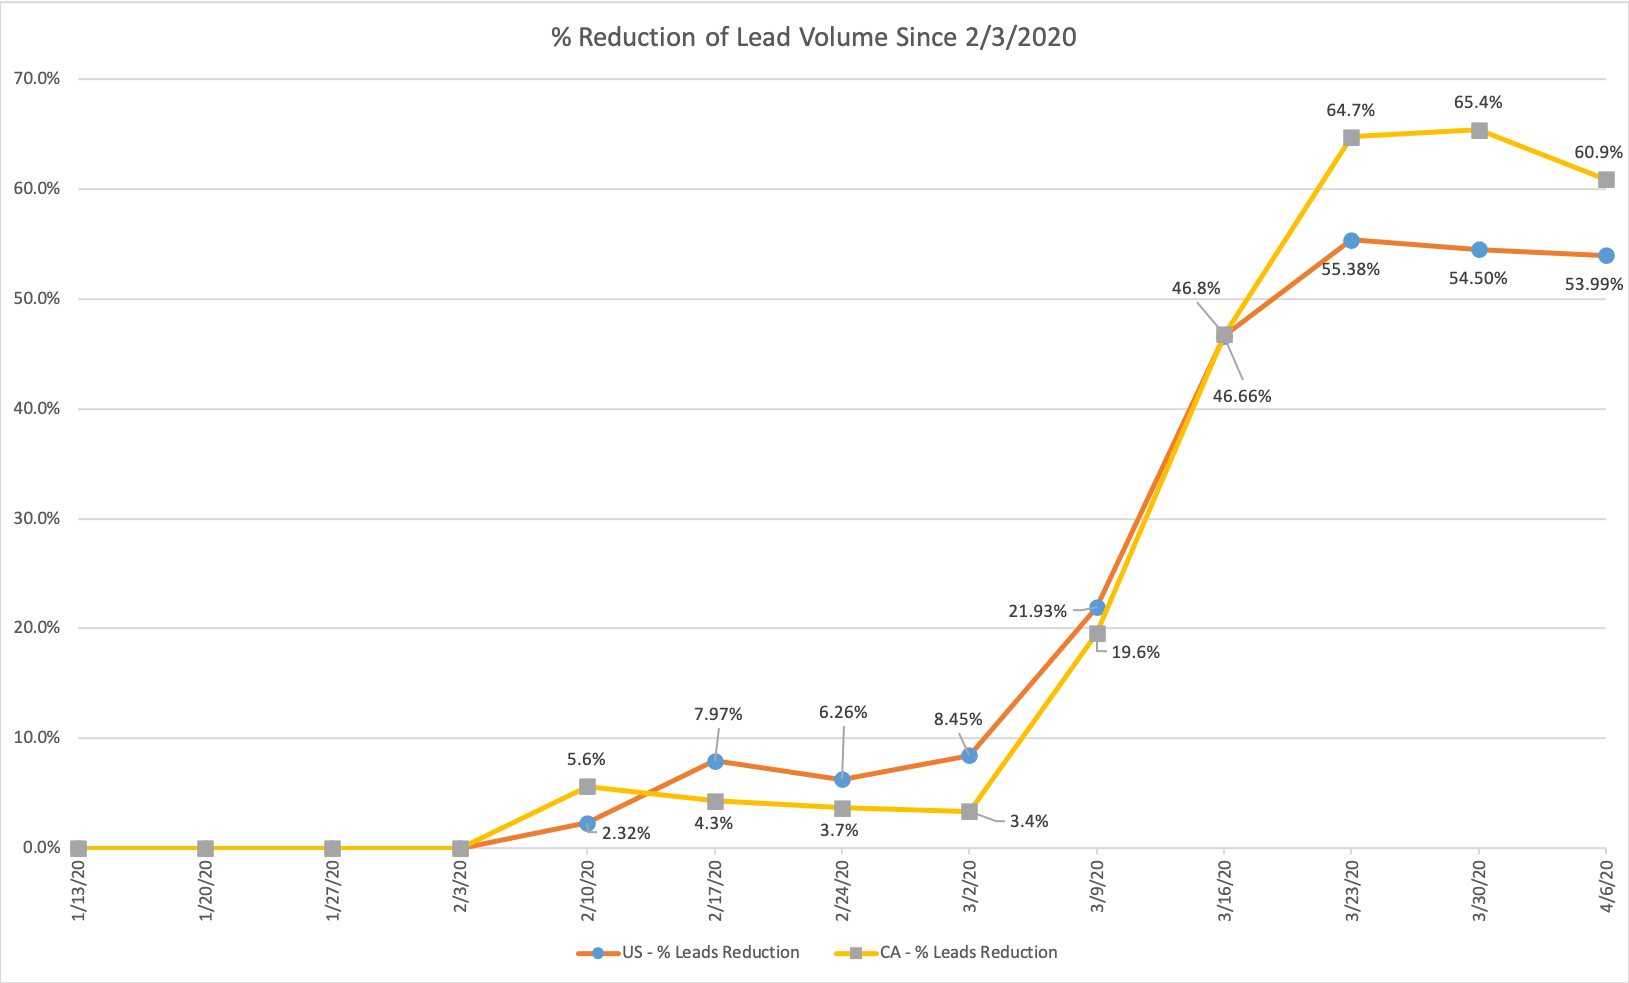
For the second week in a row, we see lead data make an improvement of sorts. This week we looked at aggregate trends just as in previous weeks but then dug into the data a little deeper to look for differences between the U.S. and Canadian lead capture losses. Looking at the week of March 30, 2020, we were encouraged to see a flattening of the lead decline. Comparing the week of March 30 to the previous week, we saw an increase in lead capture by 2.8%, not a loss. This brings the longer-range study of the total reduction in lead volume since February 3, 2020, to 54.2%.
Weekly reduction in lead capture volume study April 6, 2020
Aggregate reduction in lead capture volume study since February 3, 2020.
Details
Like last week, we studied the % reduction in lead volume at the individual client level across our U.S. and Canadian clients to find any groupings or similarities. We broke down the total percentage of lead decline since the week of February 3, 2020, for each country and in the aggregate.
Looking at all clients across specialties, we see the following trends for the week of March 30.
The total percentage of clients who have seen a less than 50% reduction in lead capture volume has increased, which we think is a good sign.
- 15.2% of clients saw increases in weekly lead capture, a decrease of 3 basis points from last week.
- 8.08% of clients decreased by between 0 and 25%, a rise of 2.02% from the previous week.
- 28.0% of clients decreased by 25% and 50%, an increase of 7.5% from the last week.
- 38.4% of clients decreased by 50% and 75%, a reduction of about 2% from the previous week.
- 17.6% of clients decreased by 75% and 100%, an increase of a little more than 1% from last week.
When we look at the U.S. versus Canadian lead capture differences, we find the following:
- Canadian lead capture had a slower reduction in the first 4 weeks of the study period from February 10 through March 2.
- Weeks 5 & 6 were almost identical between Canadian and U.S. lead reduction with equal loss values in week 6 of 47%.
- U.S. lead capture seems to have capped out at ~55% reduction, where Canadian losses increased to 64% in week 7.
- Both U.S. and Canadian leads have shown slight gains in the most recent study week which indicates a bottom, or at worst a plateau of some sort, has been reached.
March 31, 2020
Lead Decline Continues, but More Slowly
Etna has completed another study of aggregate lead capture volume for the week of March 23, 2020. Not surprisingly, aggregate trends on lead capture for Etna clients show more declines in weekly lead capture. Comparing the week of Mar 23 to the previous week (Mar 16, 2020), practices saw a decline of 14.9%, which reflects a slower rate of decline than the previous week (33%). Since Feb 3, 2020 (the highest reported lead volume of the year) aggregate lead volumes are down 54.7%.
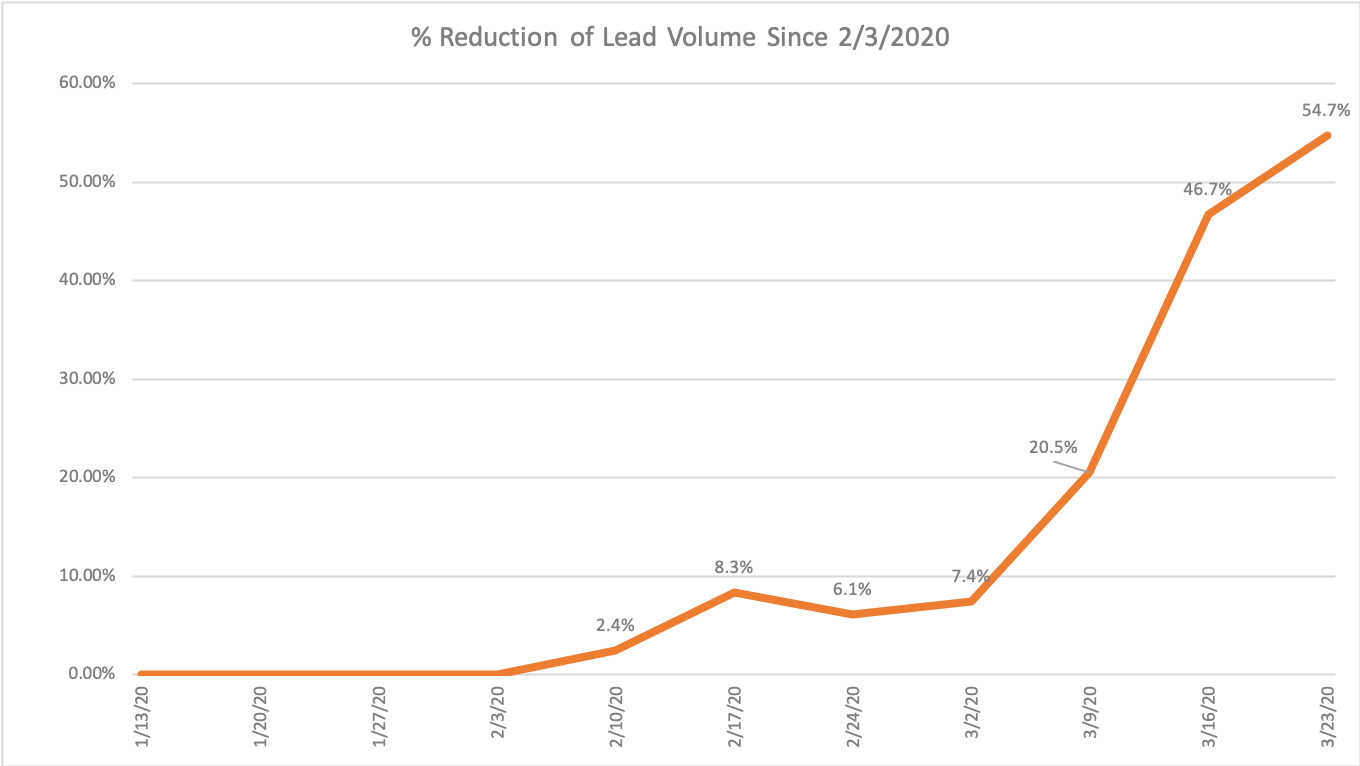
Chart of cumulative percentage reduction in lead capture rates since Feb 3, 2020
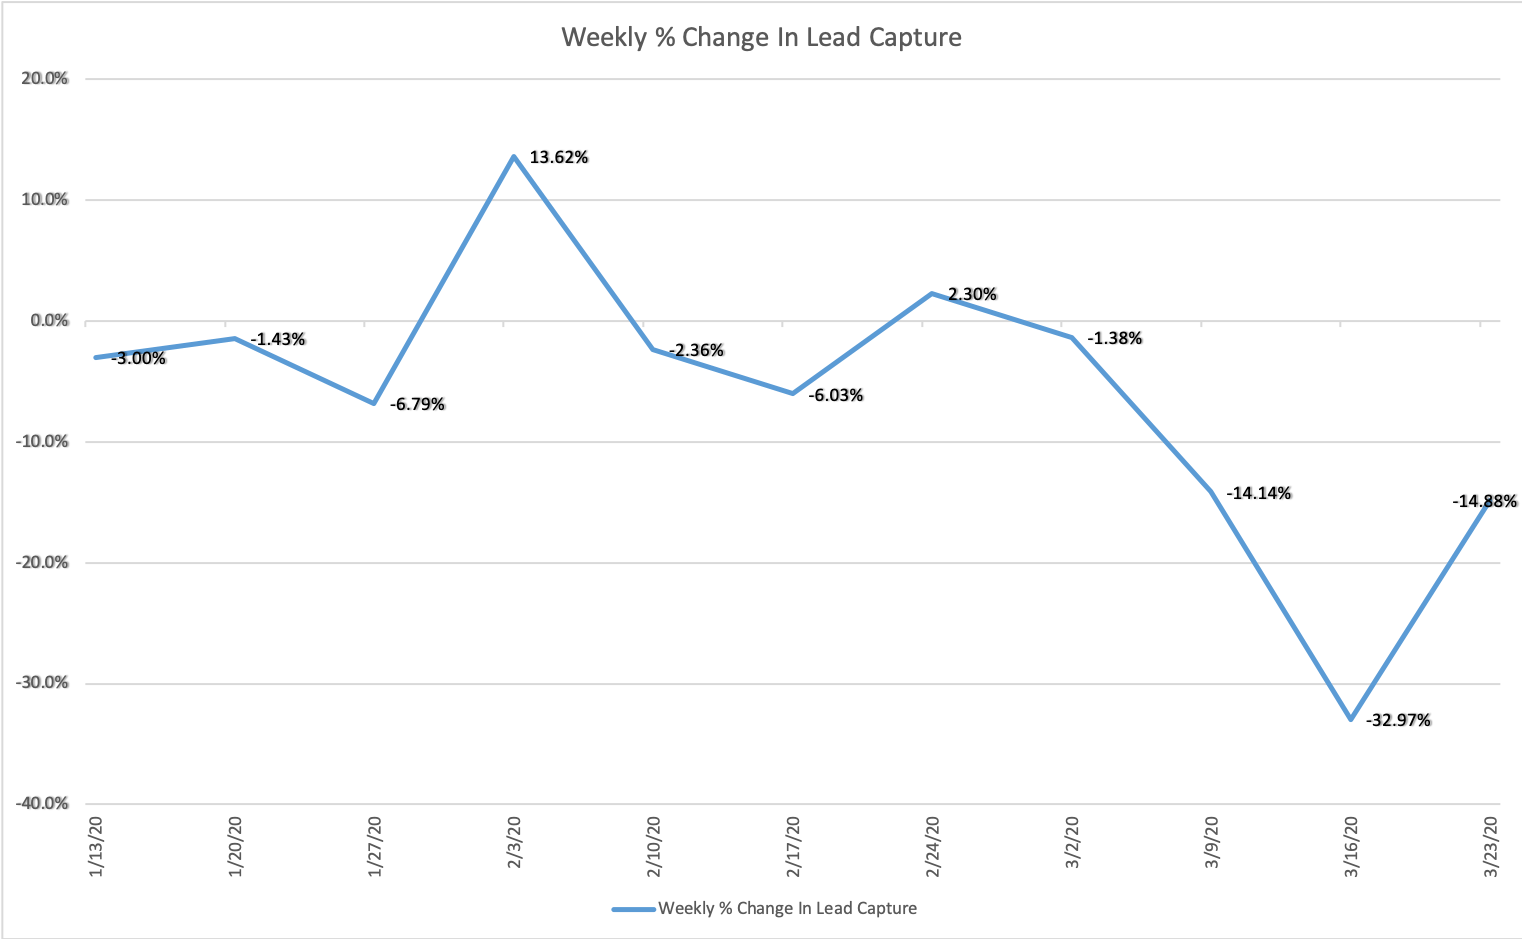
Chart of weekly percentage reduction of lead capture rates.
Details
All comparisons below are using a baseline week of Feb 3, 2020. This was the highest week of the year across the entire client population and before most North American impact from COVID-19.
Looking at all clients across specialties we see the following trends for the week of Mar 23.
- 15.5% of clients saw increases in weekly lead capture last week, compared to the high week of the year which was Feb 3, 2020.
- 6.03% of clients decreased by between 0 and 25%
- 21.5% of clients decreased by 25% and 50%
- 40.5% of clients decreased by 50% and 75%
- 16.4% of clients decreased by 75% and 100%
When we break the data down by practice type, we see similar stories to the decreases above with some notable differences for some practice types.
- Plastic surgery offices are down 54.3%
- Dermatology offices are down 58.3%
- ENT offices are down 46.1%
- Facial plastic surgery offices are down 42.1%
- Ophthalmology offices are down 37.8%
- Med spas are down 73.2%
What Does It All Mean?
We can see that the rate of decline has slowed, which may be a positive sign that we’re nearing the end of the lead slump—or it may simply be an inevitability. In any case, there are glimmers of hope. Not ALL client leads were down, which gives us a place to start digging and learning what’s working in our current reality.
We don’t have a crystal ball, but we are working diligently to figure things out. We are committed to continued data collection and analysis to help us see our partners through this rough time and capture those opportunities that present themselves.
March 12, 2020
New Research Shows the Novel Virus has Had Minimal Impact on Cosmetic Inquiries
With COVID-19 fears wreaking havoc on markets and disrupting everything from the NBA to supermarket shelves, we decided to delve into the data and see how our aesthetic clients were faring. We sampled 10 accounts for the first 10 days of March and found that consumer inquiry rates have remained steady (+/- 6%) when compared to the same period in 2019.
To dig deeper, we consulted with Enrique Rangel, CEO of MyMedLeads, a lead management and analytics tool that connects marketing efforts directly into PM/EMRs (Patient Management and Electronic Medical Records systems). He confirmed that Etna’s data precisely supports what they saw for the first 10 days of March. However, they have also observed some early signals of economic impact from the COVID-19 pandemic affecting their clientele.
“Over the past 15 days, MyMedLeads has seen a slight 4.5% drop-off in new lead acquisition for aesthetic practices. The decline in lead-to-consult rates is a bit steeper at 9%. However, it is still too early to distinguish any marked changes in lead-to-procedure conversion rates,” Rangel said.
One thing that has become abundantly clear in recent days is how quickly things can change with COVID-19. We will continue to follow the data and keep you posted on what we find.
Leave a Comment