Worried about the search activity decline on Google Trends? While on the surface, medical spa and plastic surgery terms seem to be equally impacted, there is a difference. Join our CEO, Ryan Miller, as he interprets plastic surgery and medical spa industry statistics.
Video Transcription:
Hi again, it’s Ryan Miller here with Etna Interactive. We’re here today to talk a little bit about some new data coming out of Google trends that can tell us a little bit about what’s happening with the aesthetic industry and consumer interest, at least online.
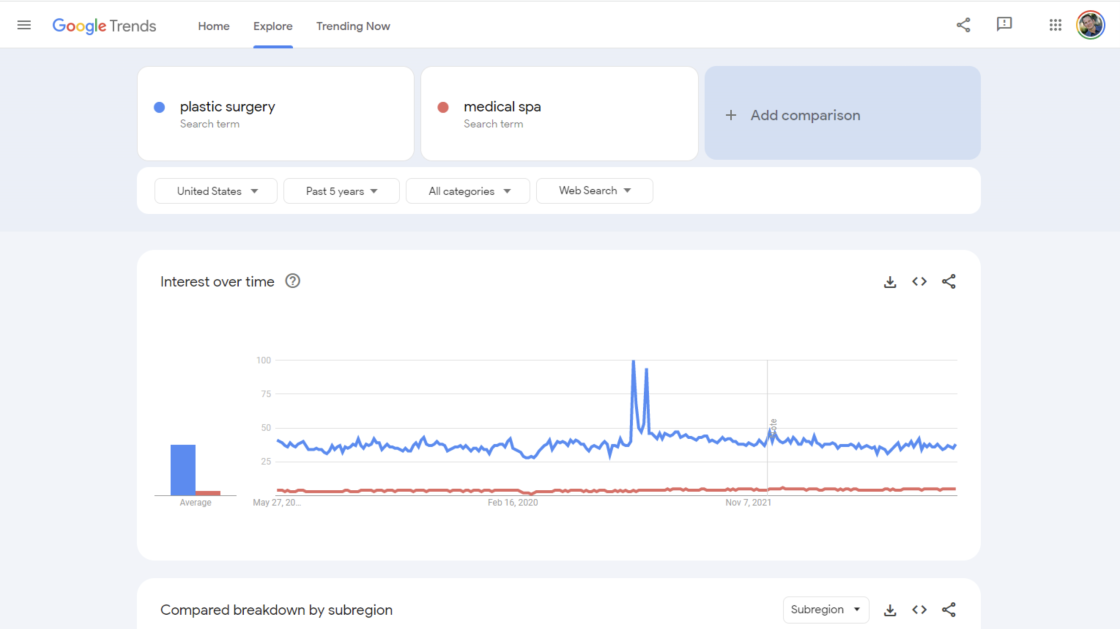
So, I want to take a moment first and orient you to Google trends in case it’s something that you’re not familiar with. It’s a free tool. You can check it out at trends.google.com, and I’ll apologize in advance because it’s a little bit addicting once you start diving in there.
Let me explain what you’re seeing on your screen on the top line first. I’ve taken two specific search queries, plastic surgery and medical spa. Those are the blue dot and the red dot that correspond to the blue line and the red line on the bottom of the screen.
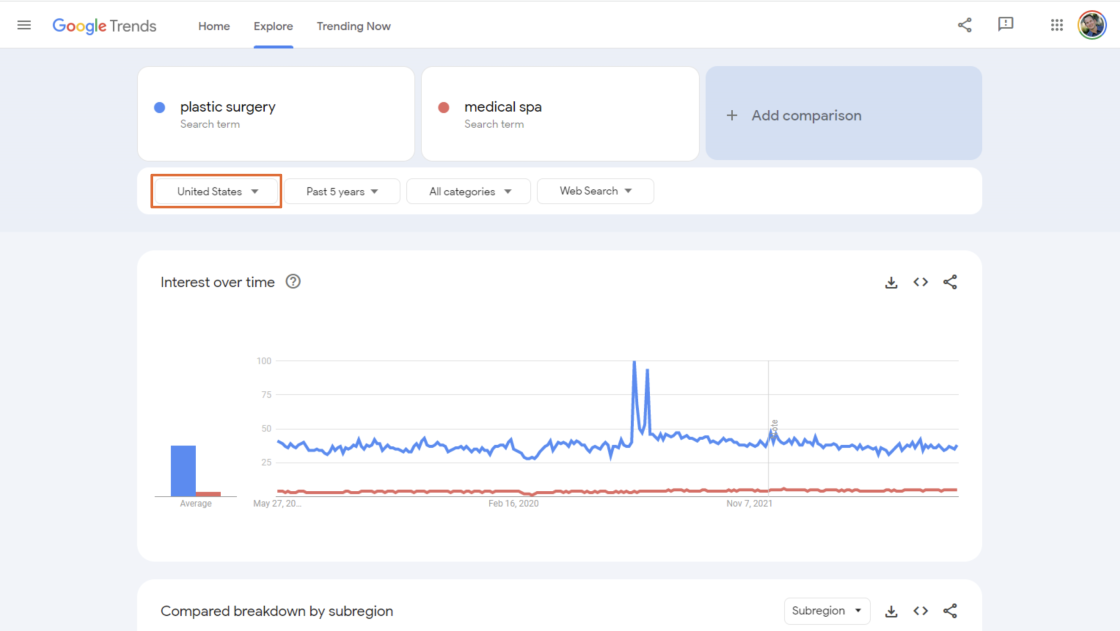
And then I’ve set a couple of filters in there. I’m focusing in on the United States for this example.
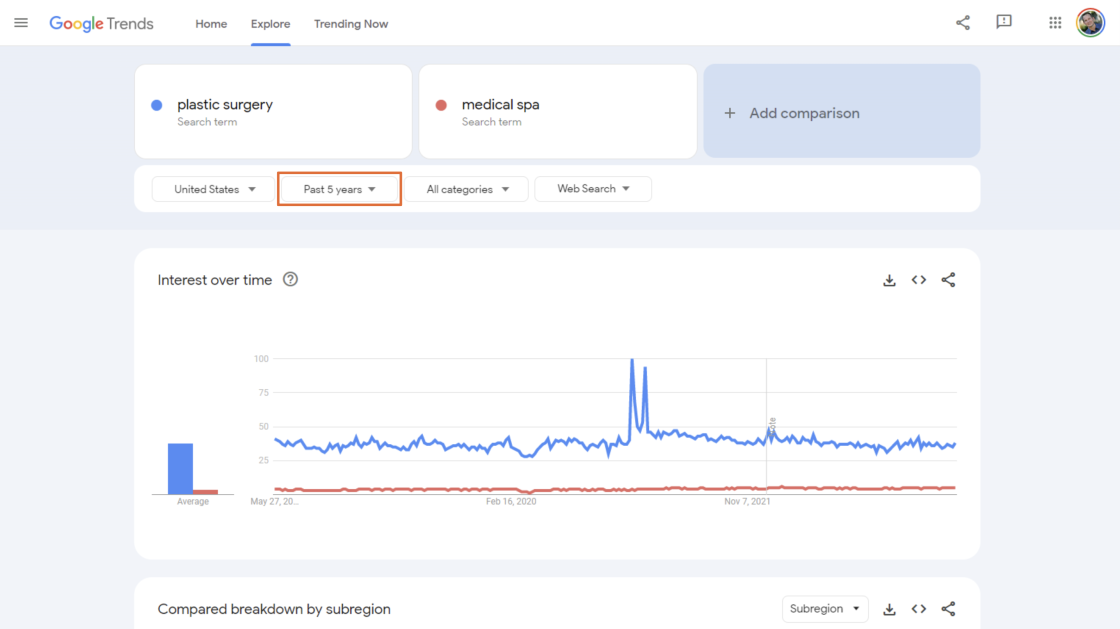
I’m looking at data for the last five years. I could have gone back as far as 19 years.
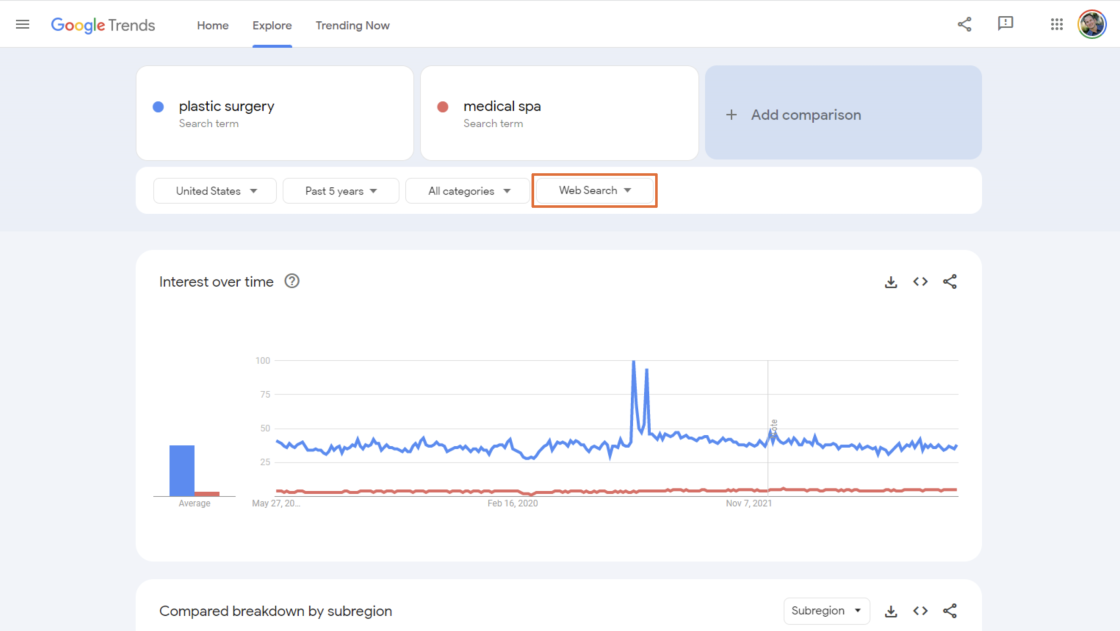
I’m looking at all interest categories and then specifically looking at activity for web searches as opposed to image searches or activity on YouTube.
Now, I get a lot of questions, specifically about the numerical scale on the left-hand side of the screen there. But if you look closely, you’ll notice it goes from 0 to 100. So, this is a relativistic measurement here. A 100 is 100% of the largest daily search volume; everything else is a comparison between the other data points on the set. So, it’s not giving me an absolute number of queries for any moment of time, just a relative count to the other data in that same sample.
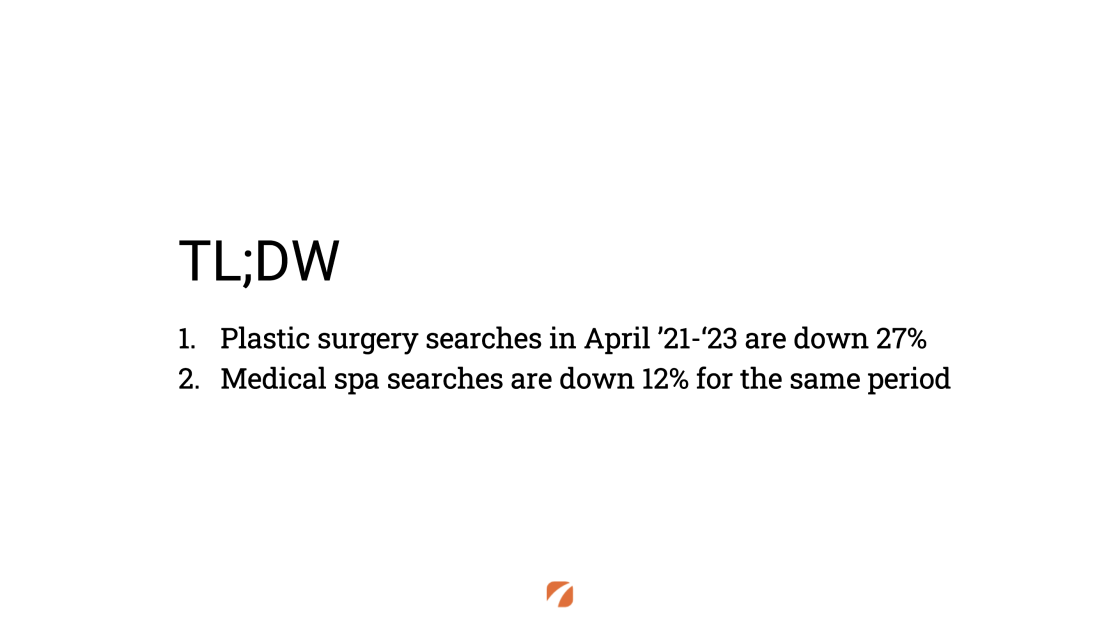
So, for those of you that are thinking, hey, it’s too long, I don’t want to watch this. Let me give you the two highlights from this data set.
First and foremost, in the area of plastic surgery, what our data showed is that the search activity when we compared April of 2023 we compared it to 2022 and 2021, but in that two-year stretch, we saw a decline of about 27% on average in the number of queries, the number of searches being performed year over year for that two-year period.
Medical spas look a little bit different. The decline that we saw was smaller at just 12%. But in both cases, the story is so much more interesting. So, stick around!

Let me talk first about what we saw in plastic surgery specifically. Now, I’m only going to highlight the data from one query here because it’s fairly representative of the whole data set.
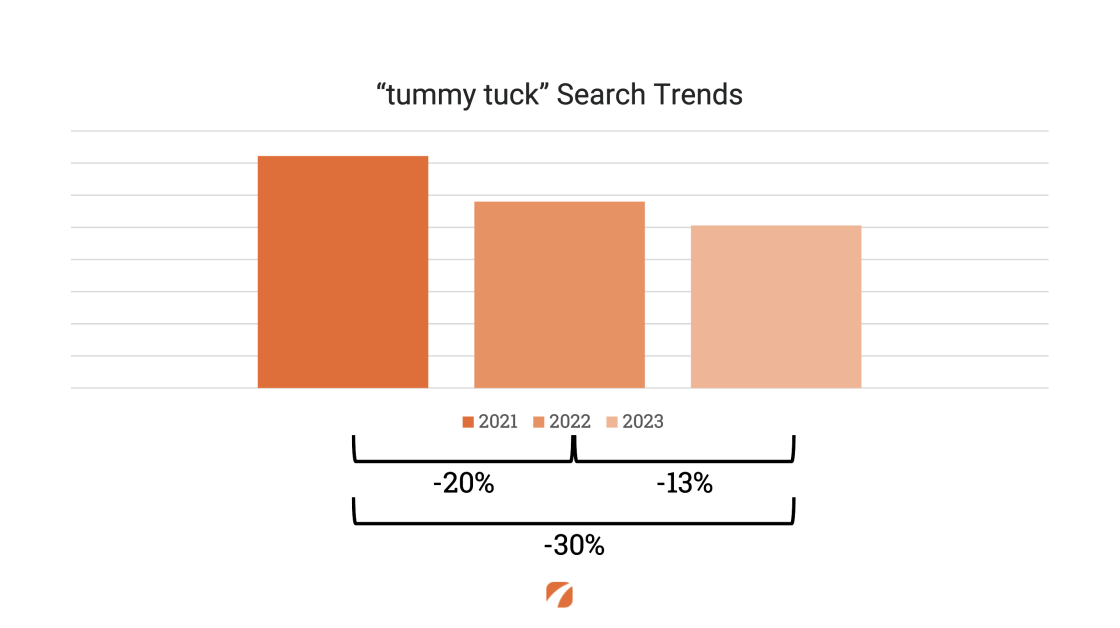
This is for tummy tuck, and we took a sample of the search volumes for 28 days of April in 2021, 28 days of April in 2022, and 28 days of April in 2023. And what we found is that from ’21 to ’22 is the biggest decline, a 20% drop in overall search activity followed by a 13% decrease. But when we compare ’21 to ’23, the aggregate decline, there is about 30%.
Now what’s super interesting when we reflect on this is that the decline is a leading indicator, meaning these are people searching; some of them may be doing just their initial research as they’re contemplating a procedure. Others are maybe moments away from requesting their consultation.
And so, this particular data here is all a reflection of what’s happening before people ultimately reach out to your offices to request their consultation.
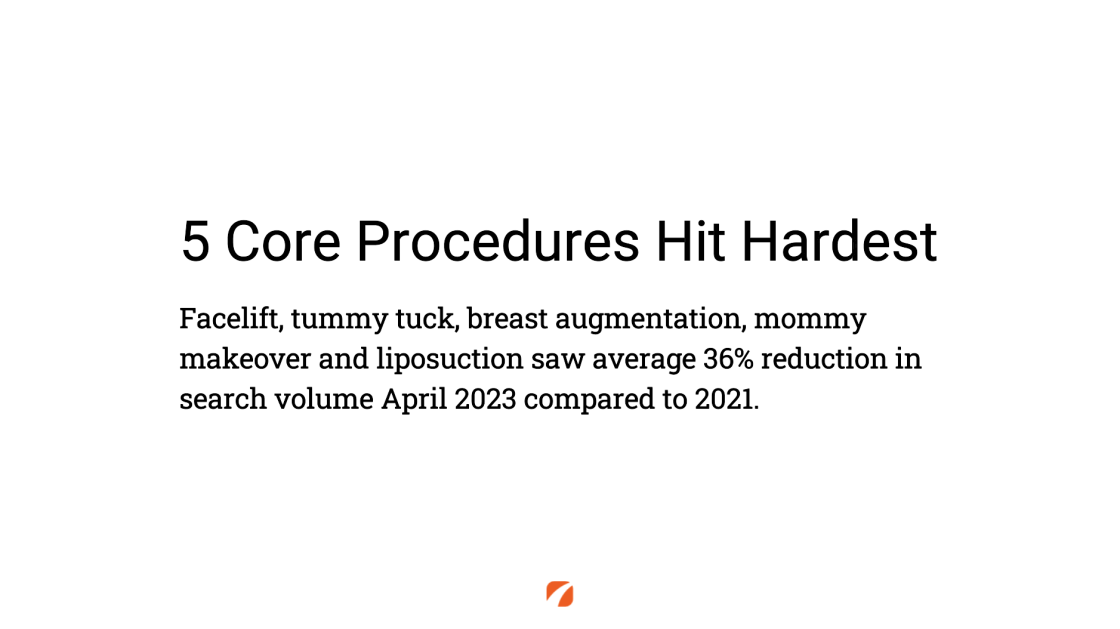
Now, what we found is that there were five of the core procedures that were hit the hardest overall; facelift, tummy tuck, breast augmentation, mommy maker, and liposuction. Not surprisingly, these are areas where with the exception of mommy maker, there aren’t really large volumes of search happening to begin with. But these five procedures were hit in aggregate at about 36% compared to April of this year to April of 2021 is where we saw this really big dip.
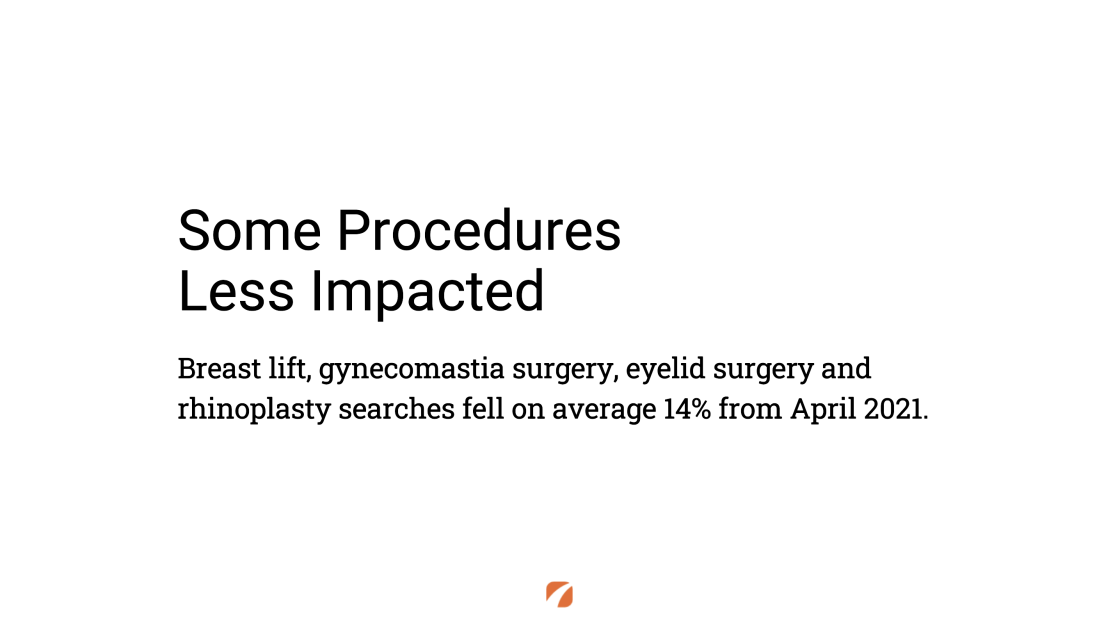
Now, that’s a little different from a few procedures that were more insulated but still off their peak. So, breast lift, gynecomastia, eyelid surgery, and rhinoplasty fell only an average of about 14% when we compare them year over year.
So, we do not have data that I feel confident standing in front of you and saying, hey, this is a specific and certain thing all across the country. But we’ve heard enough whispers from our client partners that we do think there is a secondary issue that’s compounding this decline in search activity. Which is an increased reluctance for patients to actually book on the day of their consultation.
So, we see, if we trust those reports back from our client partners, that patients are less likely to book on the day of their consultation and are taking more time overall to commit to elective plastic surgery today.

Now, the medical spa side of things is just a little bit different, but again, kind of a complicated story.
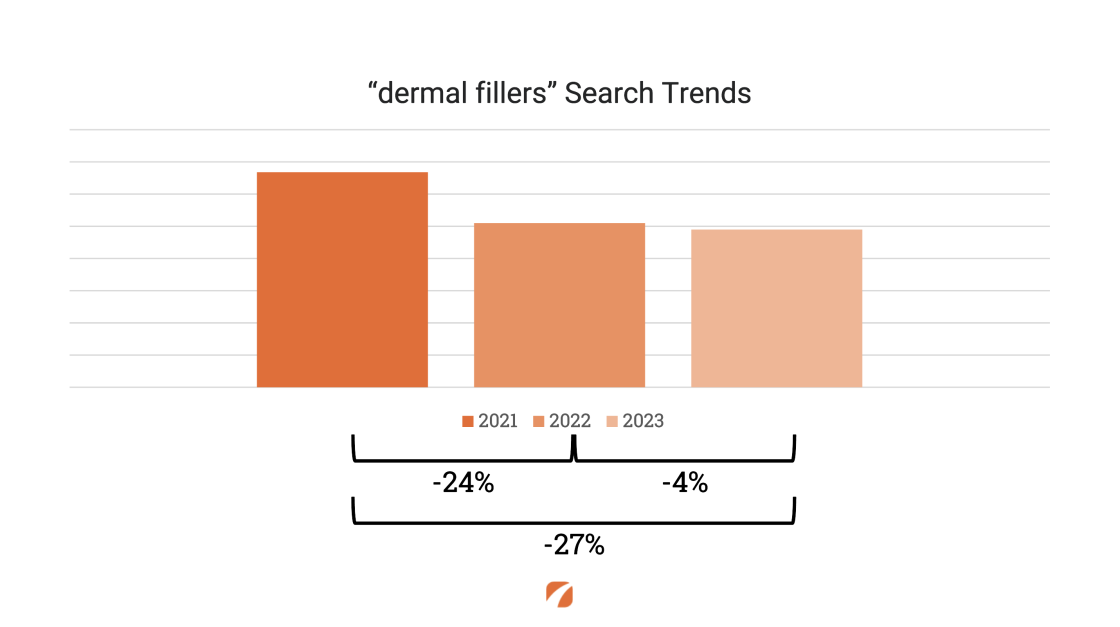
So, here we’re going to look at one example of all of the different queries that we looked at in the space: dermal fillers. And what we find is that the biggest drop would actually happen from ’21 to ’22. This is April over April, and that’s a 24% decrease in search volumes. An additional 4% decrease from last April to this April, an aggregate of a 27% drop.
So, it starts to feel like, on the surface, this is a lot like plastic surgery, roughly a 30% decline in consumer interest year over year. But I think the story is, in fact, different.
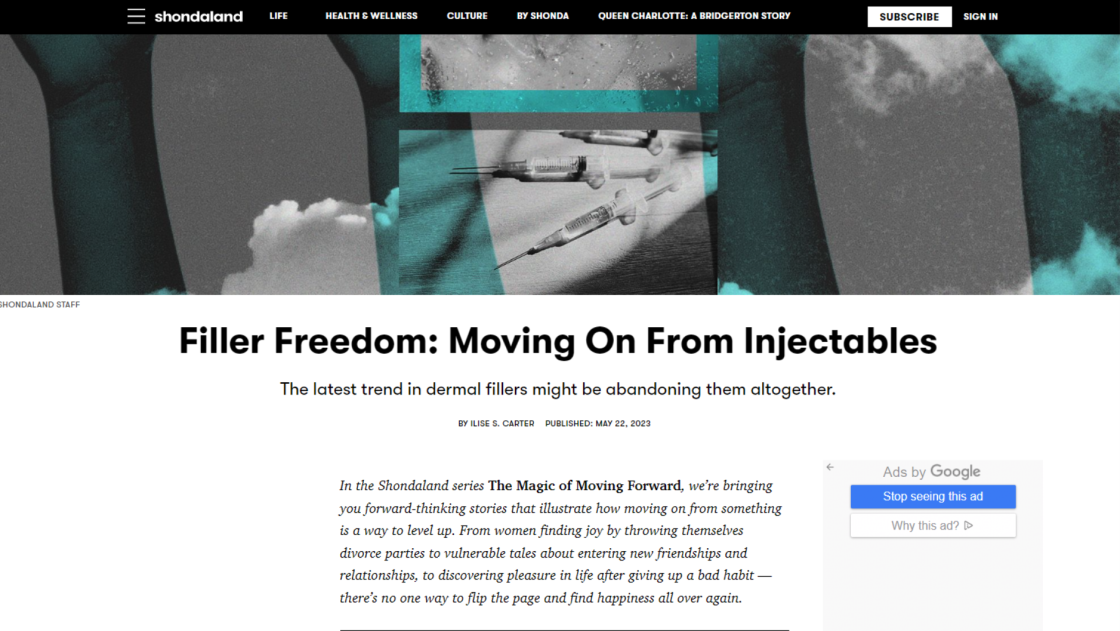
So, while I was preparing this presentation this morning, this story broke on Shondaland, and we’ve been seeing similar stories over the last several weeks and months about a decreased consumer interest in the filler category. And originally, it had kind of been reported as “consumers are contemplating fewer total syringes and less dramatic corrections,” although the tagline in this story, “The Latest Trend in Dermal Fillers Might Be Abandoning Them Altogether,” is a much more sensational headline.
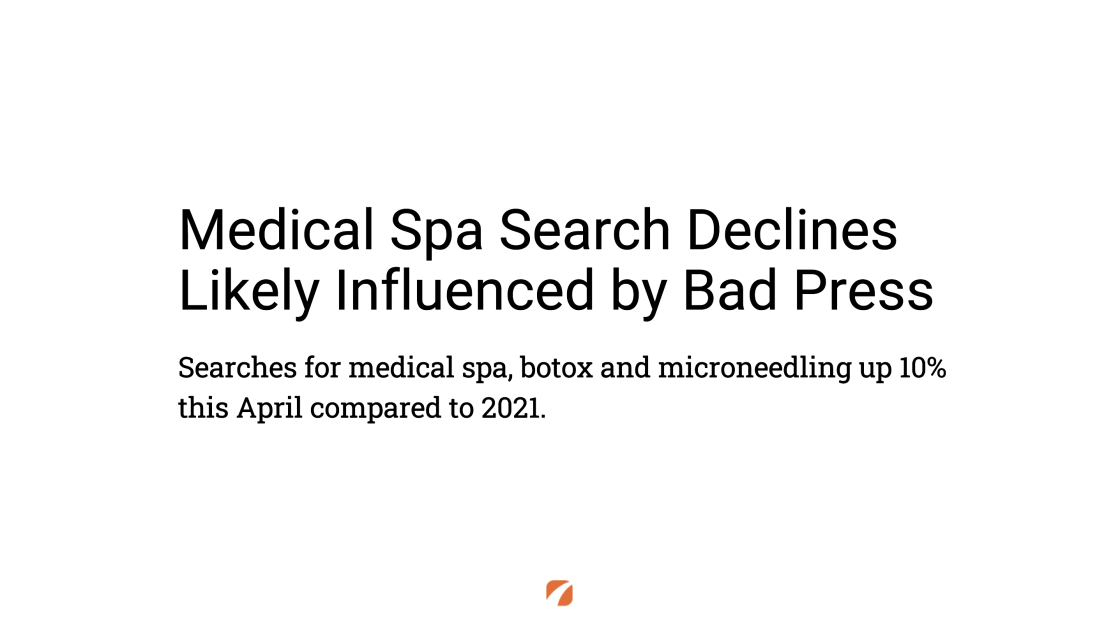
So, when we look across the sector, we can see specific instances where either bad PR or kind of a contraindicated media trending, overall medical spa seems to be trending up. So, searches for things like medical spa, Botox, and microneedling in aggregate are up about 10% when we look at April of 2023 compared to April of 2021. So, a very, very different story than what we see over on the surgical side of the aesthetic industry.

So, for those of you that are still concerned about getting ready for a recession and worried that there’s more yet to do, we’ve covered this fairly extensively in a 10-page white paper that you can download with lots of advice and strategic guidance by using the QR code. Feel free to pause and use your phone to download that PDF directly to your phone.
If you have questions about how you can prepare yourself or your practice for any change in the economy, please feel free to reach us directly at etnainteractive.com.


Leave a Comment