
What is plastic surgery demand going to look like in 2024? Our CEO Ryan Miller and COO Sean Collier come together to discuss plastic surgery demand trends from 2018 until now. They offer insightful analysis and highlight industry nuances to help you optimize plastic surgery lead generation and capitalize on marketing trends in 2024. Check out their roadmap for practices to thrive in an ever-changing landscape and what to expect from patient demand in 2024!
Video Transcript:
Ryan: Hi again, welcome back. It’s Ryan Miller with Etna Interactive, Founder and CEO, and I’m joined today by my Chief Operating Officer, Sean Collier.
Now, Sean, you’re here today to share a little bit of data that you and our colleague Shawn Hall have worked up together, taking a look at plastic surgery practice lead trends dating all the way back to 2018.
Sean, welcome. And then if you don’t mind, kick us off by just telling us a little bit about the underpinnings of the data, what did you take a look at?
Sean: Yeah, thanks, Ryan, I appreciate the opportunity to be here. When Shawn and I first built this data set, we wanted to find a way that we could understand general trending and we knew we had a lot of data inside of the bowels of Etna. But what we did was pull out a very specific set of practices to understand and be able to isolate you know control for anomalies and such.
So, we honed in on US plastic surgery practices. We made sure to look at their qualified online lead volume, right, so, these are patient inquiries that are of the nature of becoming a patient, they are coming from forms and phones. We wanted to make sure to not include our paid leads because those can be very spiky, right? You run paid campaigns at a point in time or intermittently throughout the lifespan of a practice.
Ryan: Yeah, and not all practices use PPC, so it’s fair to admit that in our analysis.
Sean: Exactly, yeah, we didn’t want to focus in on just the cohort that was PPC. We wanted to get as wide an expanse as possible. And then of course we wanted to run backwards as far as possible. We went all the way back to 2018 hoping that we could establish some kind of baseline because we knew in that middle of the data set that 2020, 2021 and 2022 we expected to see some anomalies largely due to the pandemic era and what we saw it did to practices and to consumer questioning.
Ryan: So, what did we see sort of like from the pre-pandemic period through the pandemic and out today, what does that look like?
Sean: Yeah, it’s pretty broad. And I’m going to layer in some data here for you to talk about the growth in consumer leads that we saw coming out of the pandemic or leading into the pandemic. As well as some other trends that we found about how lead inquiry changes throughout a calendar year.
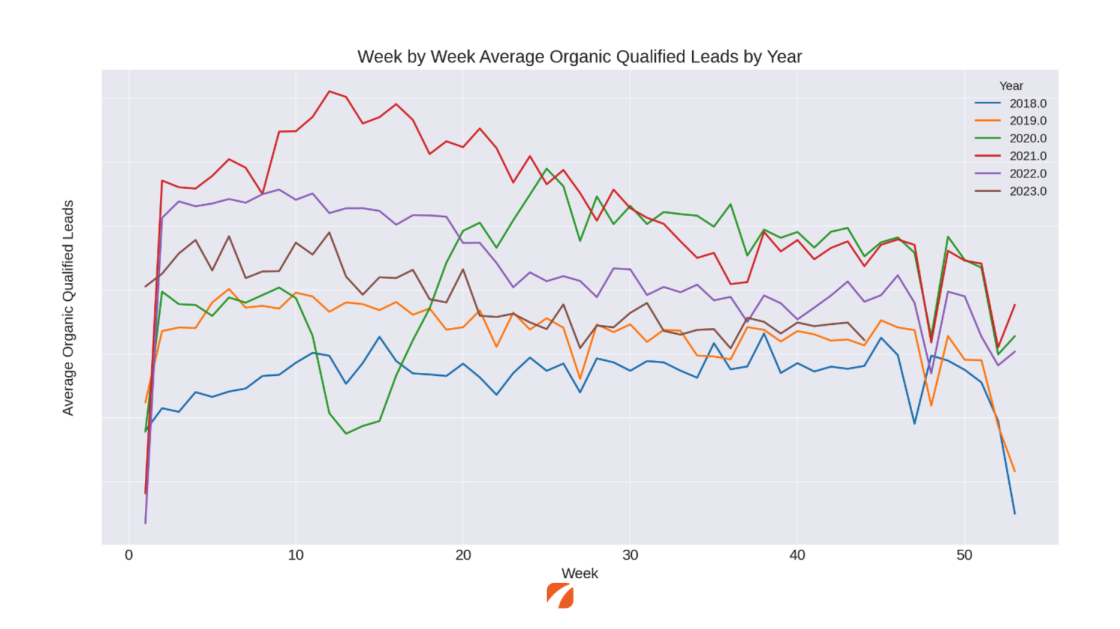
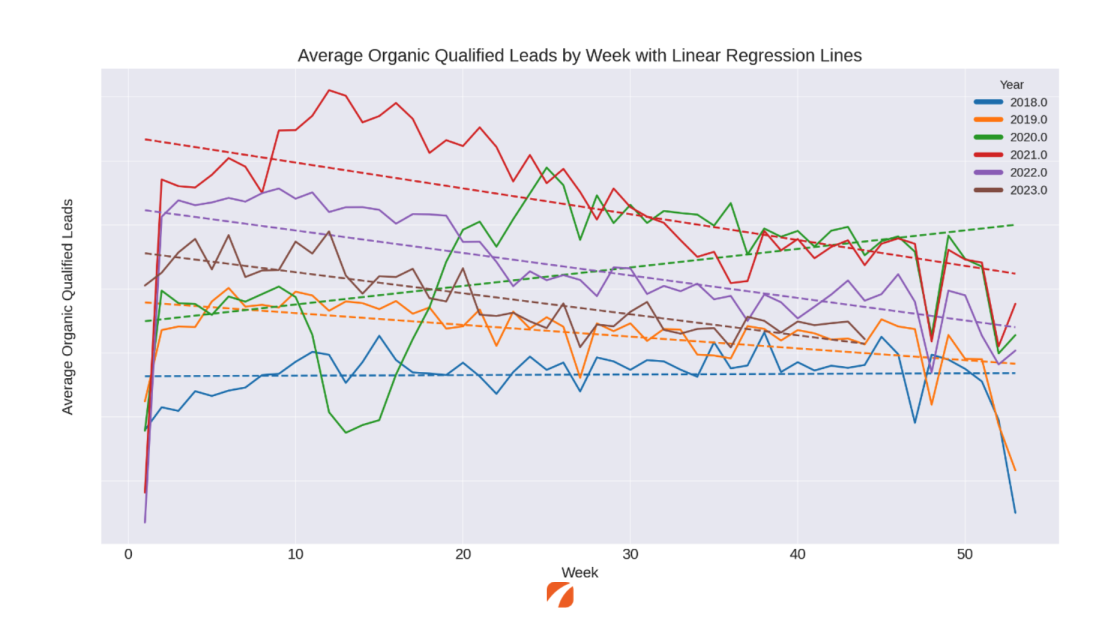
So, I’m going to pull up a chart here that’s got all the data all in one space and it’s a little bit crazy to look at, but we’re going to break it down beyond that. I figured I’d start with the end in mind and give you an idea of where we’re going. This is week-by-week average organic qualified leads as we look across the year. Again, we’re studying 2018 through 2023.
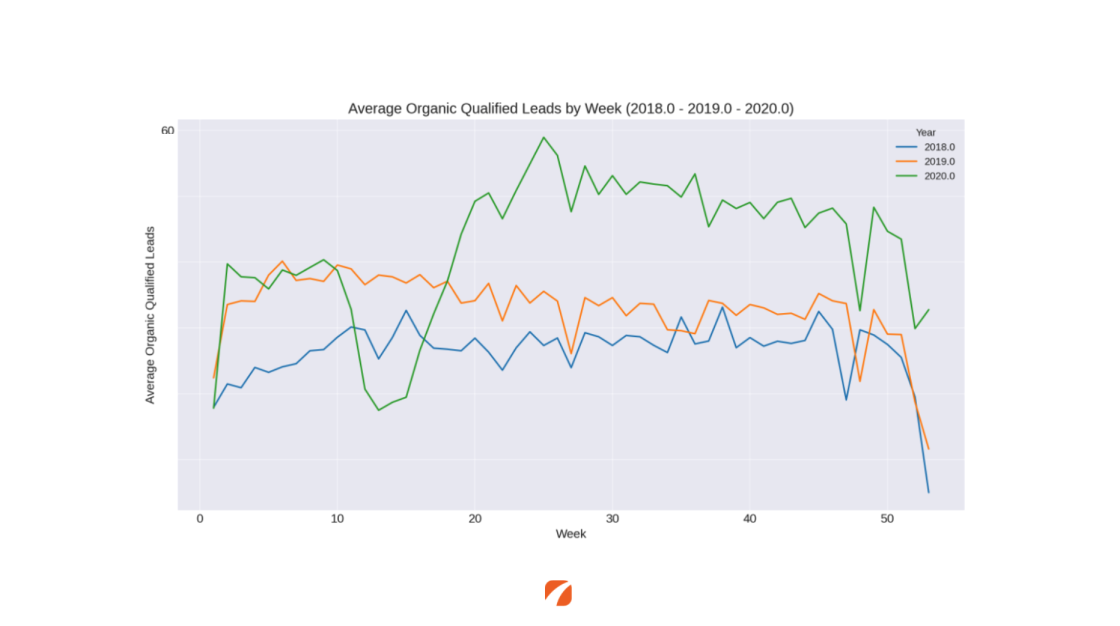
Now I’m going to peel this back and look at just 2018, well before the pandemic. We see some spikes and dips and things that we would expect around national holidays like the big V that you see towards the end of the graph there has to do with end of year, you know Christmas time. Thus the drops that you see at the beginning and end mostly had to do with where the week cuts off as these are focused on weeks of the year, week one through week 52. Then as I start to layer things on here, you’ll see that I’ll get some different graphs. So, I assume now we layer on 2019 again another somewhat normal year, obviously not pandemic. You can see some trends happening in mid-year time frame and in end of year time frame. And then I layer on 2020 weird things happen in that first quarter, we all know what that was.
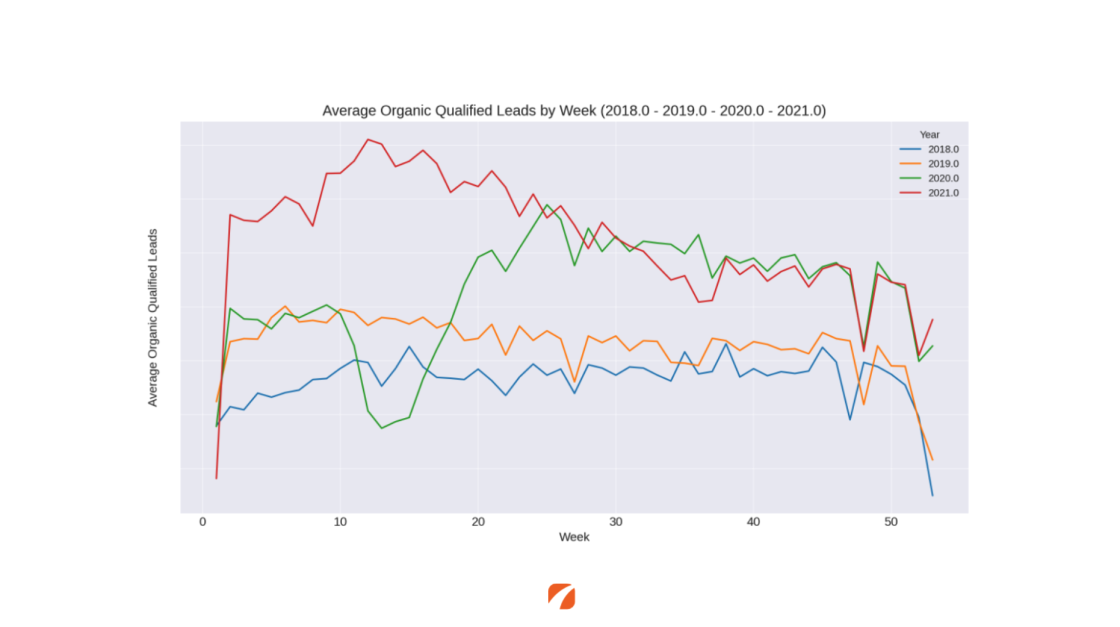
Now really start to focus on that lift. As we come out of week 15 and head into week 20 through 25, right the middle part of my graph, we see a huge rise in patient inquiries. When we go into 21, we now have established a new beginning of year. My end of years are starting to look the same and in fact I can see that 2020 and 2021 are almost identical at the tail end of the graph. We still get the drops for the holiday season, but the volume is overlapping.

Now here’s where things got really interesting from a data analysis perspective. When we throw in 2022 and then 2023 year to date, starting back at the graph that we, you know, began this conversation with, I see a notable drop year to year. So, focusing on the left side of the graph in weeks one through 10 or one through 15, it’s a step-down function, and it looks like we are returning to levels that we saw in 2019.
Ryan: If I can pause you for one second there for our viewers that are like trying to catch up with the legend on the right side. The purple line there was last year, that’s 2022, that brown line that’s not complete, that sort of dips out there just near the end of the graph, that’s this year, that’s 2023. And so red, purple, brown, we’re going 2021, 2022, 2023 in terms of the baseline, take it away from that.
Sean: We think, using that word baseline that 2019 and what we’re seeing between 2023 and 2019 is a return to baseline. The behavior of lead volume, week by week, when we look at 2023 and 2019 starts to look very familiar. Apart from the green line, as things accelerated into 2021, we see step down functions. The big top red line and then stepping down year by year as we head down here.
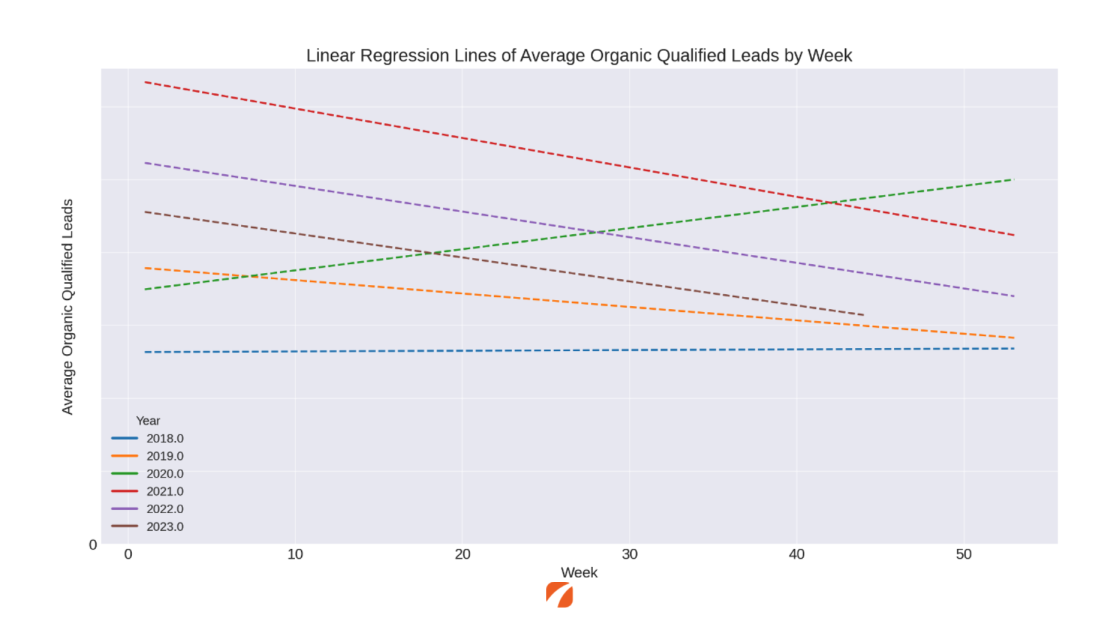
The other thing that stood out to us was the degradation or the reduction in lead volume week by week as we move through the calendar year. And so, we decide to look at that and in the form of a linear regression. I’m going to lay on that linear regression line, and then I’m going to remove the noise. So here you can see all the same data points, but now in a linear regression format. And you can see the red, the purple, the brown and the orange. They all follow a negative slope as we move from the beginning of the year to the end of the year.
And specifically, what we were able to find here is that there are two points in the year that tend to be higher or peaks for plastic surgery lead generation at the practice level than in other points of the year. And they tend to peak by about 20% compared to the preceding and trailing weeks. But all of it tends to come down as we head into the end of the year for these plastic surgery practices.
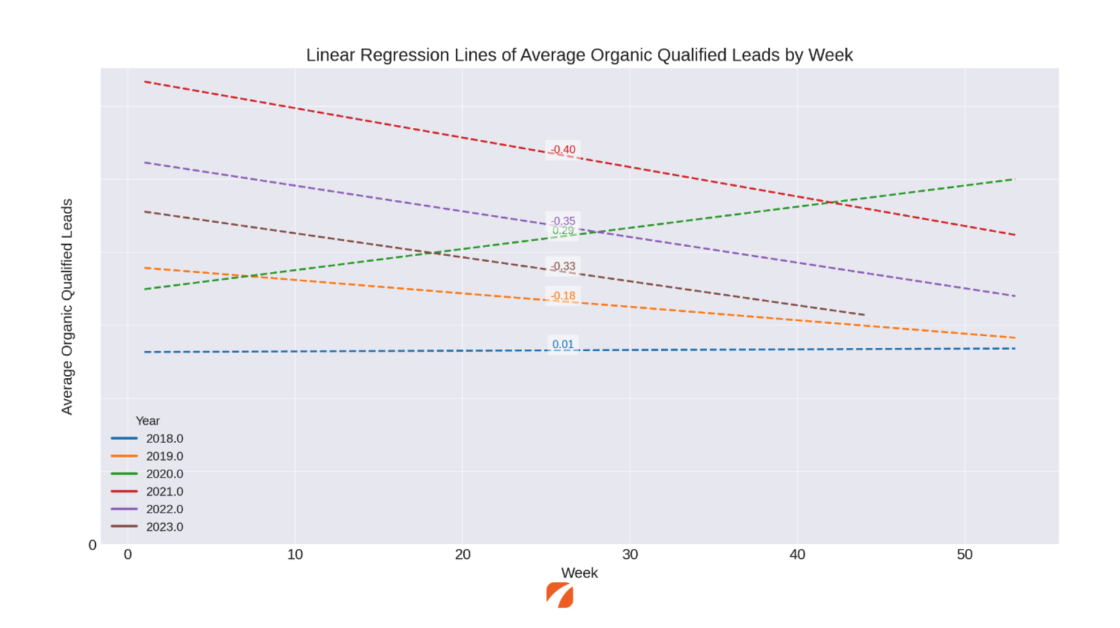
When we looked at that, not only do we see the step-down function, so just a total volume of leads are decreasing, the rate of decrease changed. I’m throwing in what’s called the slope value or the regression slope. I have a negative 0.4 for that top red line, then a negative 0.35, and then negative 0.33, and then negative 0.18 which is that 2019 line. The slope is getting less as we return to what we think is the baseline around that 2019 time frame with anomalous years of 2020 obviously as it scaled into the back half of the year and 2018 being essentially flat.
These data values are showing us, that the consumer’s mind has shifted in terms of volume and in terms of how quickly we are degrading throughout the year.
Ryan: Excellent, so Sean, take us here really quickly. You know there’s a lot of data on the graph. What do you think are the most salient, the most important observations that you’re going to be able to take away from that?
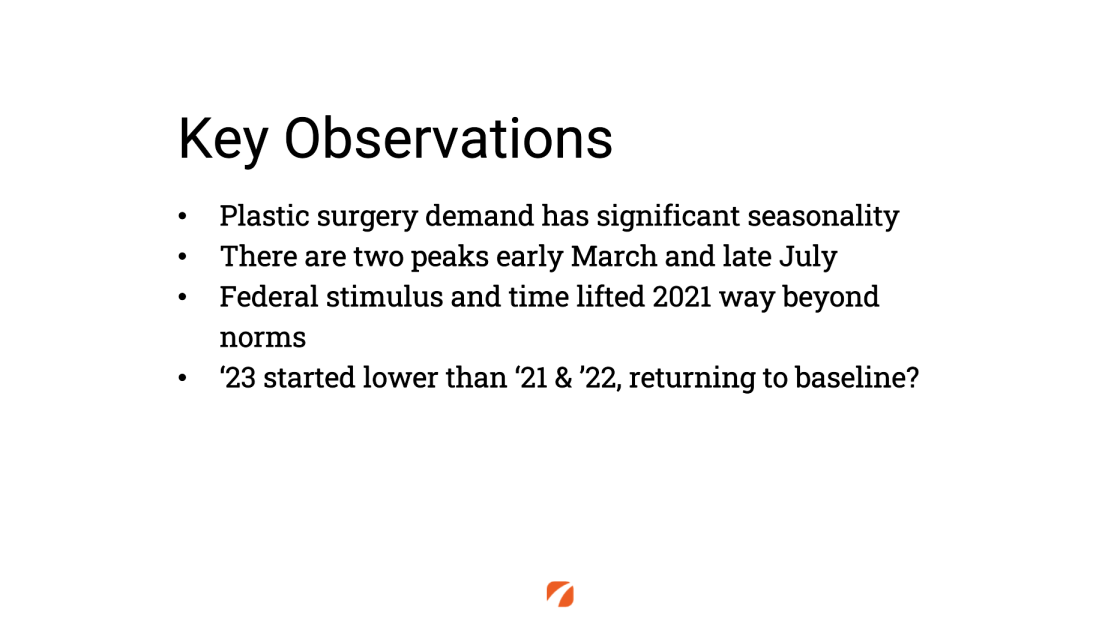
Sean: Yeah, thanks Ryan. There is a lot of data there. The first one is that we have a statistically proven degradation in lead volume as we head through the year. Meaning that we are a seasonal service line being plastic surgery and that there are two key peaks, one of them is in early March, the other one is in late July.
Ryan: Let me pause on that because I think this is important. Those are peaks in lead generation and patients either emailing or calling the practice. Obviously, there’s going to be a lag between the moment of inquiry and what may be perceived inside the practice as peaks and how much time the doctors are spending in the OR how busy the actual surgical schedule feels.
Sean: Right, this is about consumer intent. So, consumers in that early March time frame and late July timeframe for plastic surgery businesses, these are the peak times when they are soliciting and saying I am looking for help, I want your services. Those two peaks are really interesting and maybe we’ll touch on those towards the end about what you could do with that knowledge.
Next is thinking about federal stimulus money and that shift of things. As we saw the graph shift up from 2020 to 2021 and then back down to 2022 and 2023, we think that has adjusted what happened in those years.
We saw that 2023, as you saw, it started lower than 2021 and 2022 and we believe that this is returning to a baseline or that 2019 averages that we saw out there.
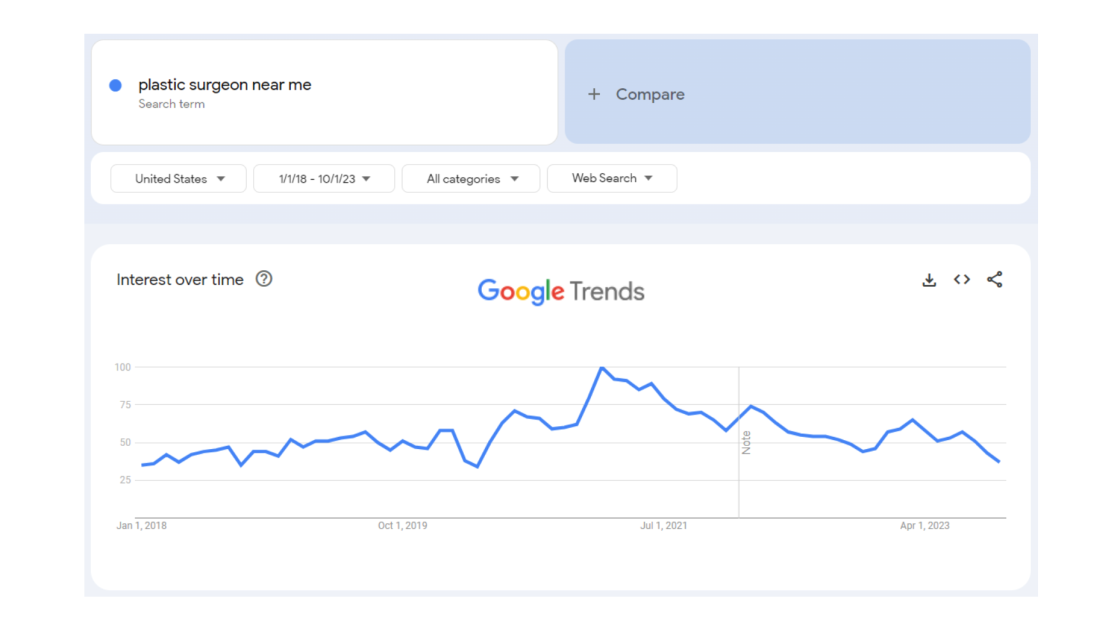
Ryan: I wanted to take this analysis, look at other things that we have that sort of surround our own data set. And so after you guys shared this data with me a week and a half ago, a lot of us inside the organization started nerding out on this a little bit and going deeper, scratching at other sources of data. If you’re not familiar with the tool, there’s a thing called Google Trends, which allows you to enter in a single query or multiple queries and then study how those trends have performed volumetrically over time, how many people are searching those things.
I rolled back to the same period that Sean and Shawn were studying, January 1 of 2018 on this graph coming out to roughly today. And 10/1 was the date range that I set there for plastic surgeon near me. Presuming this is sort of an expression of consumer intent. This is ignoring a little bit that five years ago people may have been a little bit less inclined to say plastic surgeon near me, a little bit like lower penetration of mobile phones, but not that much lower.
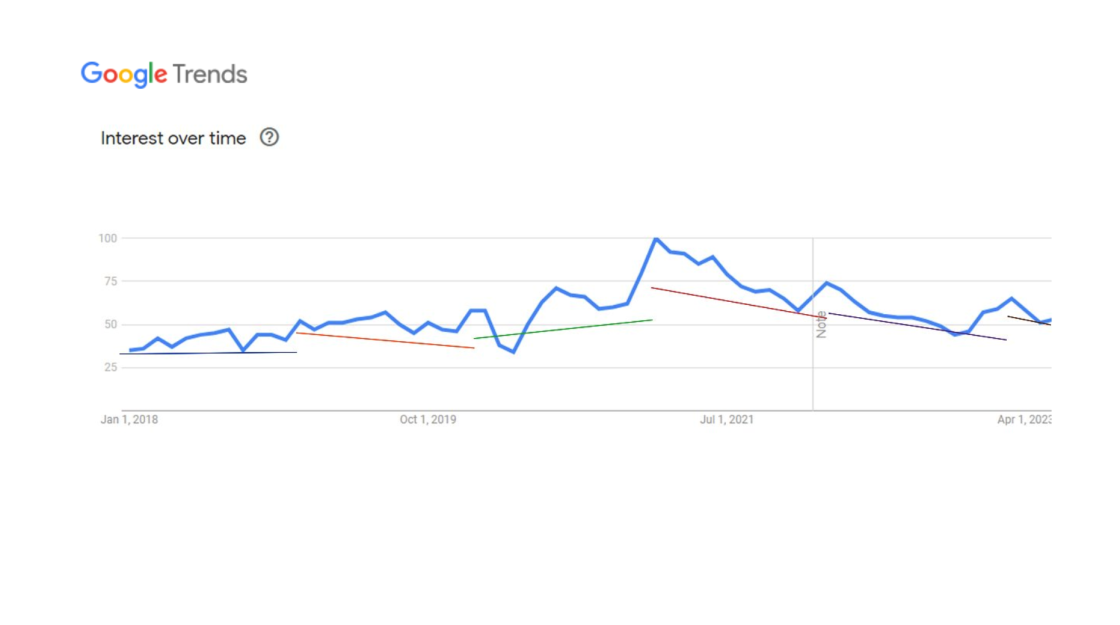
But we see a very similar curve to what, Sean was laying out there. And what was interesting is, I took that Google Trends chart and I preserved those linear regressions and preserved the volume and just sort of overlaid it on what we were seeing in terms of consumer demand. And we see some really strong correlations between how people are searching and the resulting lead volumes, for one simple query. It also looked like another graph that we found, this is a graph taken from the US Bureau of Economic Analysis. This is the measure of household savings in the United States, so how much are people squirreling away for a rainy day?
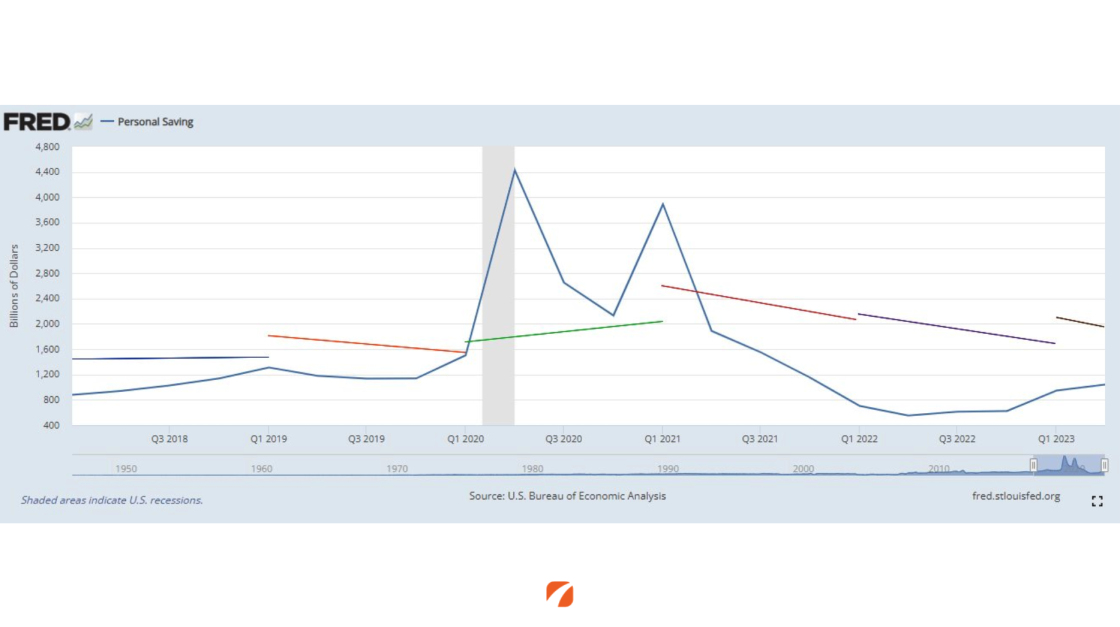
Not surprising, there we see the gray bar in the middle of the line that corresponds to the start of the pandemic, and the eventual payouts of stimulus monies going into people’s accounts. Not only do they have some extra time to have some money, but again, when I lay over what we see happening in terms of market response, obviously there’s a little bit of a delay between the accumulation of savings and how consumers spend, but we start to see some really similar behaviors.
What’s worth noting is Sean and his analysis independently arrived at the idea that we’re moving back towards a 2019 baseline in terms of lead volume. Incidentally, we are also moving back towards a 2019 baseline in terms of household savings. We see this chart if you kind of follow it all the way over to the far right side, you know we see that people are kind of in that general range of savings where they were over on the left hand side there.
So we sort of touched on this idea already. Sean, I’ll ask you based on your data and looking at historical comparisons, what are we forecasting that plastic surgeons should expect as this year closes out in Q4 of 2023.
Sean: Yeah, I think it will feel a lot like it did or should have at the end of 2019. Meaning that we’ve already reached basically our lowest points of the year. It should be relatively flat with the exception of big national holidays, that happen in there. The really surprising thing for me will be what do we look for in the beginning part of next year? So, kind of where you’ve gotten to this year, with the exception of some action from holiday campaigns and depression due to travel and things that people do during the holiday period, it should feel more or less like what you have today.

Ryan: Now looking ahead at 2024, this is the hard thing, I hate when I’m put on a podium and asked to talk about this, like, what do you think the future is going to hold? 2024, the beginning of it’s not that far away and I think our data is pretty suggestive of what’s likely to happen. So, you know, if you had to put your forecasting hat on, what does that look like?
Sean: Yeah, that’s interesting. You know, when we talk a little bit about the prognostication, there are three factors that we think are impacting it. One is the federal stimulus, as it’s related to personal savings rates. We’ve seen those savings rates skyrocket and then plummet right back down, so that’s had an impact.
I think we’ve also seen an impact due to the cost of consumer credit, the prime rate. If you can plot the prime rate, you’ll see some impacts on that, mostly at the tail end of the graph.
And then lastly is inflationary tactics. The prime rate is a driver to try to control for inflation tactics while inflation tactics are also going up. We think that those things are cascading to the declines that we see and mostly shifting the line down. As you saw the line shift down from 2021, 2022, and 2023, we think that they will return slightly above 2019 levels because there’s still consumer credit out there, consumers are still behaving as they should, the Fed doesn’t necessarily think that they’ve squashed everything out there and the data is almost matched between 2023’s data and 2019’s data at this point.
Ryan: I’m going to summarize that as saying we think we’re going to see a rebound, so the year will start off stronger than it finishes this year. So, 2024 is going to start stronger, but not as strong as this last year. 2024 is going to start off a little quieter than 2023.
And then do we have any reason to believe that it wouldn’t follow that similar linear regression maybe slowing in terms of the pace? That it’s going to be a year that as we forecast even further it’s going to start to look more and more like maybe a slightly boosted version of 2019.
Sean: Yeah, I think 2024 will look like a slightly larger beginning of year than 2019 and less than 2023 as we noted, obviously less than 2022. I think we will still see that peak in the March time frame and the peak in the July time frame and those peaks are significant as we think about marketing to consumers and responding inside of a practice.
Ryan: And as we pull this all together, we talk, OK, well this is great, good observations, if you trust us. What does it mean for your practice and what do you need to do?
The first thing that we want to recommend is just auditing recent performance. Something we do routinely with our clients – although when times are good, some of you don’t always want to audit your data – is to actually go back and pick a quarter in time or a couple of quarters, run those audits. Both so that you can compare yourself to national benchmarks that we have and compare yourself to some points of your own historic performance. To understand numerically, one of our core values is to make it measurable, how are we really doing? Are we doing as well or better than we expected?
The reason why we suggest that is obviously there are practices right now that are looking more critically at marketing performance, and then post lead capture – how are these patients maturing inside the practice?
We’ve discovered some really interesting things and we’ve encountered practices that are doing really creative stuff. I’m thinking about one practice that we work with that when we started scratching closer at the data and what appeared to be problems with conversion, we found that about one in five calls weren’t actually being answered. And when we dug further, there were actually members of the staff that were aware that there were problems with the phone system. But because they had just been so busy, it never got fixed. And something as simple as fixing how calls were being routed took these lost calls and turned them into immediate opportunity.
On the other side, we see practices making progressive decisions right now, things like promising a 10 minute response time on all of their online forms. But it’s all about going back to those sales basics and asking ‘are we doing the right things in terms of handling the opportunity that’s coming in, technically? Are we doing the right things, operationally?’ And maybe, just maybe ‘are we innovating how we’re offering service in a way that might give us an edge in leaner times?’
Finally, as we think about this, it can be really, really hard to manage to pull off a lift at times like this when market demand is at its lowest. However, we are forecasting that the best time that’s going to come next year is going to happen by week 10 of 2024. So now is a great time to be thinking about – what are we going to do to push our visibility to maximize lead generation during that window of time? Sean, what were the weeks? It’s like between week 10 and –?

Sean: Yeah, the beginning of March. So technically weeks 10, 11, and 12 time frame and then late July.
Ryan: So, the first half of the year is really going to be the strongest period that you’re going to see. And it’s really about how do you connect with as many patients as possible? Talking if you are an Etna Interactive client, talking specifically with your account executive about what are we going to be doing in the first half of next year to make sure that we are able to get as much value as possible out of the beginning.
So our advice in summary is get ready to push the peak, be looking at positive steps that you can take now to increase that visibility and exposure. And Sean, I want to thank you and our colleague Shawn for all the time you guys spent putting that analysis together for that data and it’s just invaluable.
Leave a Comment