

The change from Universal Analytics to Google Analytics 4 will affect how your website performance data are reported, and we want you to be ready. We’ve highlighted some differences between both platforms and some of the transitional issues we’ve observed. Join our CEO Ryan Miller as he outlines what steps Etna is taking to get our clients’ sites ready for GA4.
Video Transcription
Video Transcription:
Hi again, it’s Ryan Miller here with Etna Interactive, but we’re here today to talk about Google Analytics 4 and really some important news that could impact every medical practice.
So, what is Google Analytics 4? For those that aren’t familiar, Google Analytics is the platform that is probably the most popular piece of software in the world for measuring website performance.
Now, on July 1 of this year, Google is going to sunset the old program called UA or Universal Analytics in favor of their new technology called Google Analytics 4, which I’m just going to refer to as GA4 for speed after this point.
And the thing that’s important to recognize is that GA4 is an important reaction to a change in how the world works. When UA or Universal Analytics first rolled out, a website was really the only thing you needed to think about. Well, today, people move quickly between websites and apps, and we need to be able to track behavior in both environments. In addition to that, globally, they’re involving privacy laws that are motivating Google to change what their platform is and how it functions.

There are some really important changes, they’re a little bit dry, but I think they’re important for business leaders to understand, especially those of you who like to dive into your own data.
Throughout this presentation, I’m going to try to share information that will be interesting to any medical practice leader, but I am going to have some important notes that are just for Etna clients, and I’ll call those out whenever I make them.
It’s important to recognize that universal analytics, the old platform, and GA4, the new one, are a little bit like apples and oranges, or if you’re like me and you have a one-year-old, everything in my world right now is apples and bananas. So yeah, they’re different; you can’t compare them.
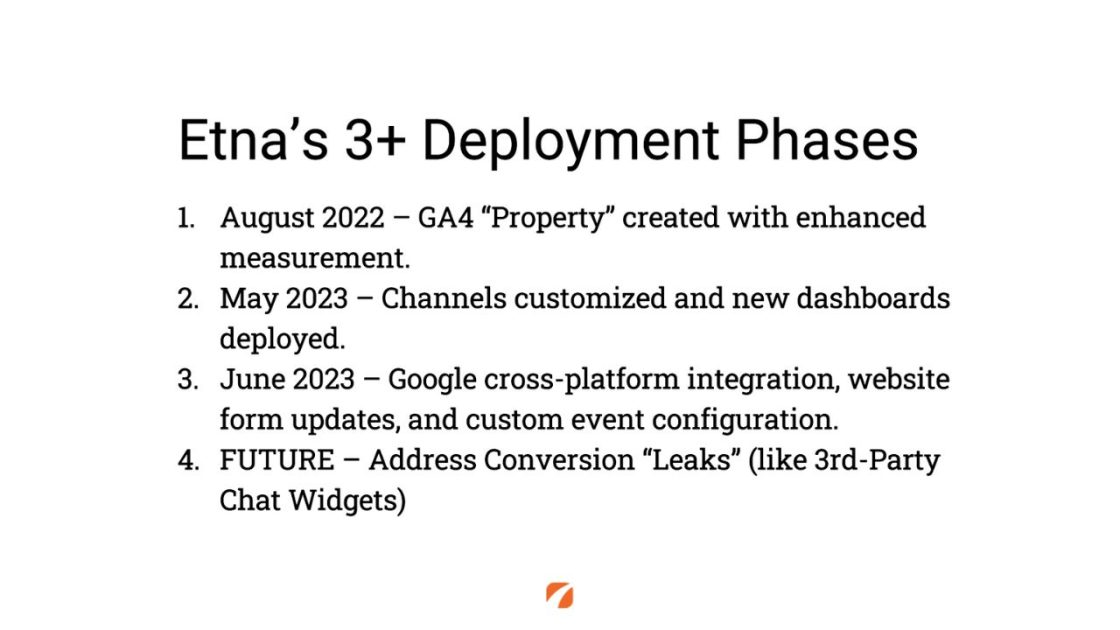
So, for that reason, we’ve deployed universal analytics for our clients in three particular phases.
The first one actually happened in August of last year. Because we knew the data wasn’t going to be easily compared between UA and GA4, we wanted to help our clients begin to gather as much data as possible inside of GA4. So, we deployed it in August of last year, and it’s been capturing data quietly in the background in parallel to Universal Analytics all throughout that time.
In just this last month, in May of 2023, we did the next phase of deployment. Another quick phase deploying a new set of dashboards and connecting GA4 to those dashboards so that on July 1, we’ll be able to give you some beautiful new reporting that is an enhancement on what you’re accustomed to getting in summary each and every month.
And during the month of June, there’s a much bigger effort that’s going to be underway to actually modify the forms and how they’re configured on your site. We configure what are called custom events and flag those events as conversions so that we can get the most robust data possible about what is working to help attract new patients for you and for your practice.
Now that 3+, There is a stage that we can imagine for the future. We know that we aspire to plug leaks into conversion tracking. For example, for those of you that use third-party chat widgets, we don’t always know what happens with those people who initiate on chat. We don’t have a vehicle today to aggregate that information along with your other conversion data. We know now, though, that it’s possible, and we’re looking for ways in the future to enhance the reporting that we can get out of Google Analytics 4.

If you want to take a look at what Google Analytics 4 looks like, most of the reports that you might have seen in Universal Analytics do exist in there under the reports section. Although, the basis for the data collection is a little bit different, and so the numbers might look different than what you’ve seen in the past.
Our position with all of our clients is that it’s your data; you own it. You should have unfettered access to it. So, you can log into your Google account, you can go to https://www.google.com/analytics if you’re uncertain whether or not you already have access, and you’ll see data right away. And if you don’t see data, just let your account executive know that you want to be granted access to those reports if you’re super curious to take a look in there yourself.
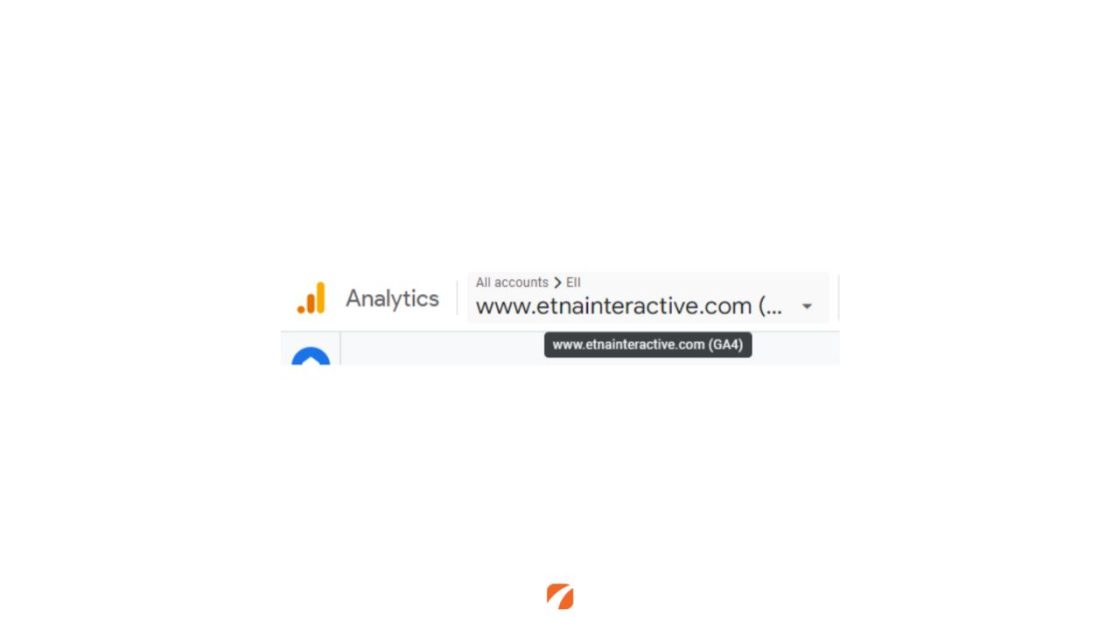
Now, in addition to that, once you get in there, recognize you have more than one property. A property refers to an instance or an installation of one of these cohorts of tracking. And once you’re inside, in the upper left-hand corner, you’ll see a dropdown menu that will allow you to switch between your older UA properties and your new GA4 property. You can recognize it because it says GA4 in parentheses at the end of the website address.

Now, GA4 we found is not perfect.
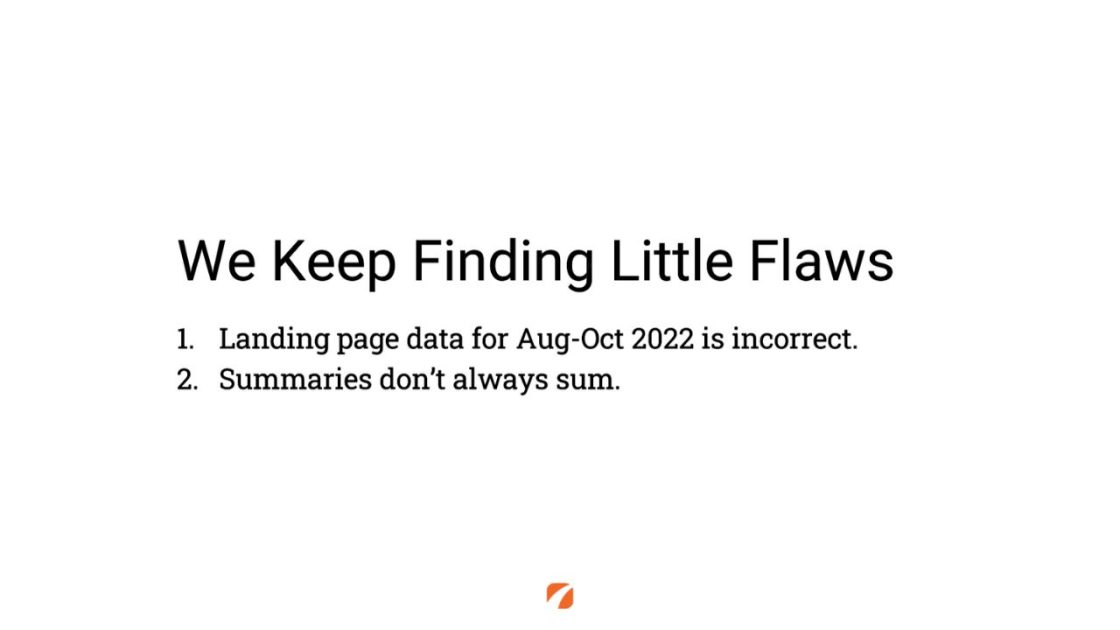
There are a couple of little errors, a lot of which have been already fixed by now, but there are two that are persistent.
We noticed that in the data for the landing page reporting that was collected between August and October of 2022 that there was an apparent roughly doubling of the actual volume of traffic coming in on that report. Google seems to have quietly fixed it near the end of October. But that’s a segment of data we know that we can’t look at from a comparative standpoint because it’s just not reliable.
In addition to that, there are a lot of interfaces where the summaries don’t sum.
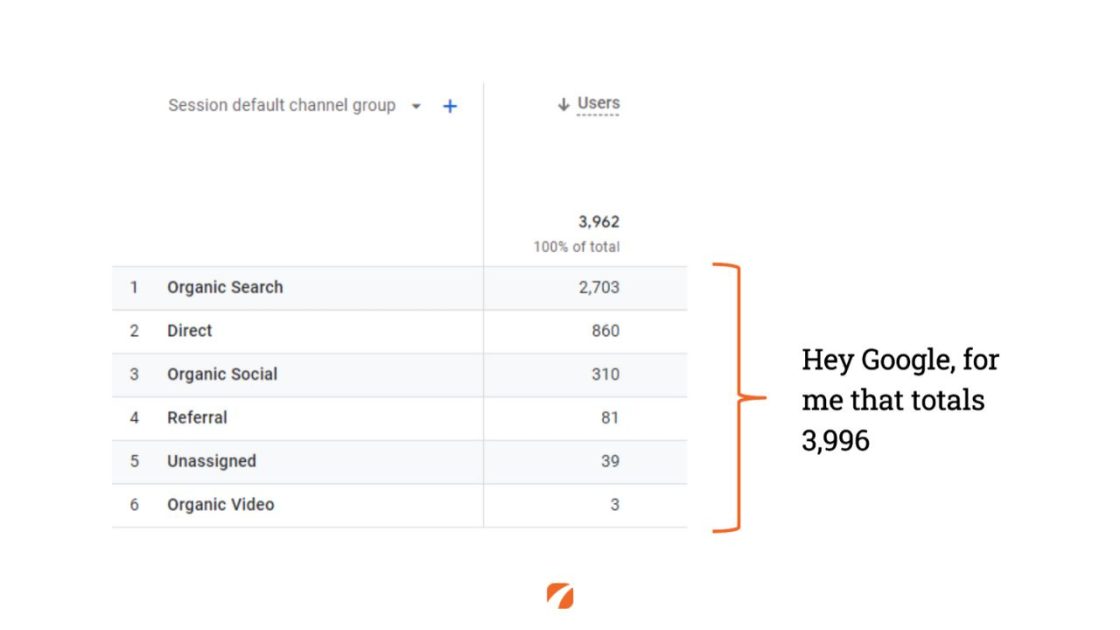
And I’ll give you an example here. This is a traffic acquisition report taken from Google Analytics 4, the new reporting. It’s rolled up under channels, and I’ll talk about that in just a second, but what I want to call your attention to is the 3,962 that you see at the top of that column. If you’re really wanting to check my math, feel free to pause this video right now and sum up those lines.
I don’t know about you, but for me, they add up to 3,996, and I can’t explain the difference between those two things. So, we’ve got to take this new tooling with a little bit of a grain of salt and trust that it’s generally going to point us in the right direction. And that it will be more or less consistent over time, which is what we need a tool like this to be.

So next section here, we’re just going to highlight some stuff that’s new and different. This is going to be especially valuable for those of you who like to look at your own data directly in Google Analytics because you’re going to have to start thinking differently about what you see.
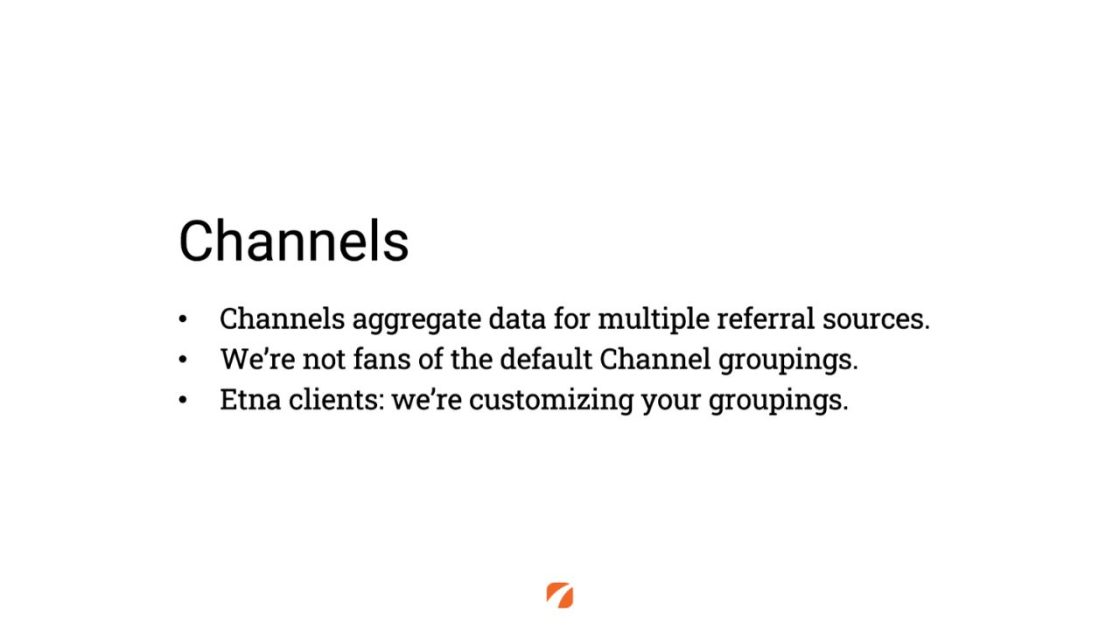
First and foremost is that the majority of the reports today default to channels. Where it was more common in the past to see source medium reporting being kind of the centerpiece of what we talk about.
Channels aggregate multiple sources and mediums together, so a source and medium might be like Google as a source, a medium of organic. Well, organic search would roll that up with Bing as a source and organic search altogether under one clear category or label.
In addition to that, I think the thing that we have to disclose is we don’t like the decisions they made for default channel reporting, but the good news is they allow us to customize it.
And we are doing that at least for our own accounts because we want to be able to see things, for example, their default organic search channel aggregates the organic search, the 10 results at the bottom of that first search page, and the map pack results which are usually those three search results that are adjacent to a pictorial map, it lumps all that together. And we know that if we can split those apart more readily, we can spot changes and trends more quickly in case we need to react.
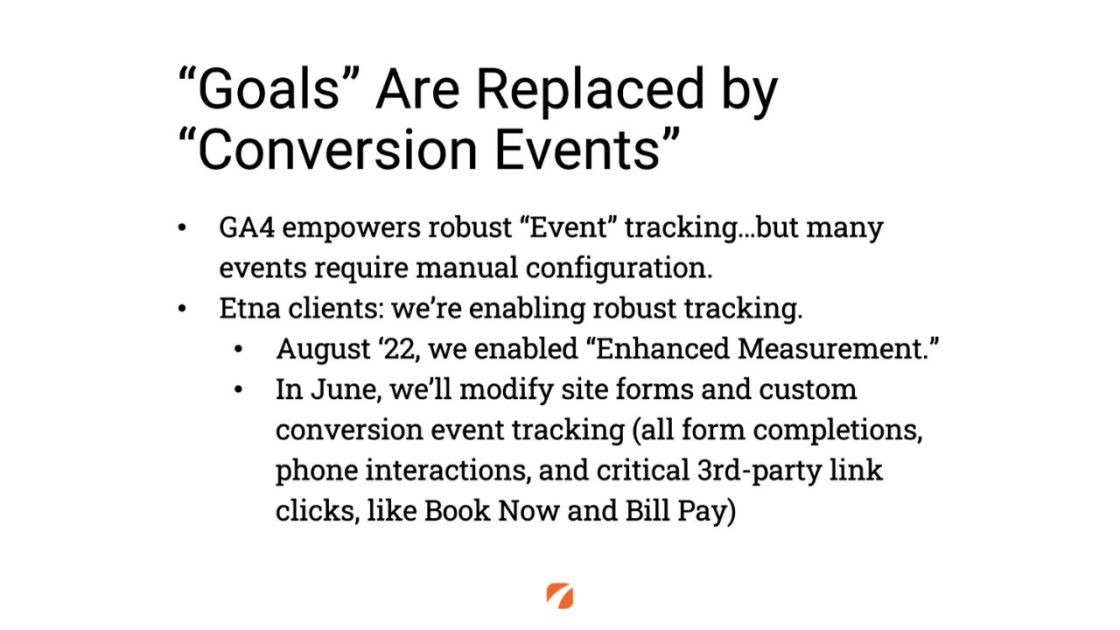
So, the other thing to keep in mind is in UA, the old tool, we would talk about goals.
Today we talk about conversion events. So, the beautiful thing about GA4, in fact, I think it’s probably one of the things it’s best at is this has much more robust event tracking. We can track things like video interactions on the page and the old things like form completions that are also important. And we can track them in multiple different ways. So, the thing that I think you have to recognize is if you’re accustomed to looking at goal conversions in the way that you analyze your data, today, you’re going to want to look for conversion events instead.
So, Etna clients, what we want to tell you is that we’re doing some really robust conversion reporting for you, and here’s the way that we’re approaching it.
So, last August, we enabled something that’s called enhanced measurement. This is the default setting that, when turned on, captures a bunch of events automatically.
In addition to that, as I mentioned in June, we’re going to be doing a larger project that is going to be manually configuring your site so that we can see all of the important conversions.
Now, these are the obvious ones, like triggering and clicking a call on a mobile device or filling out a form on either mobile or desktop. But also some things that are maybe a little bit less intuitive. So, for example, those of you with patient portals, or book now, or a self-pay link, that are actually third-party tools that are taking the user away from the site. We still think those people are converting and will be setting those up as conversion events as well.
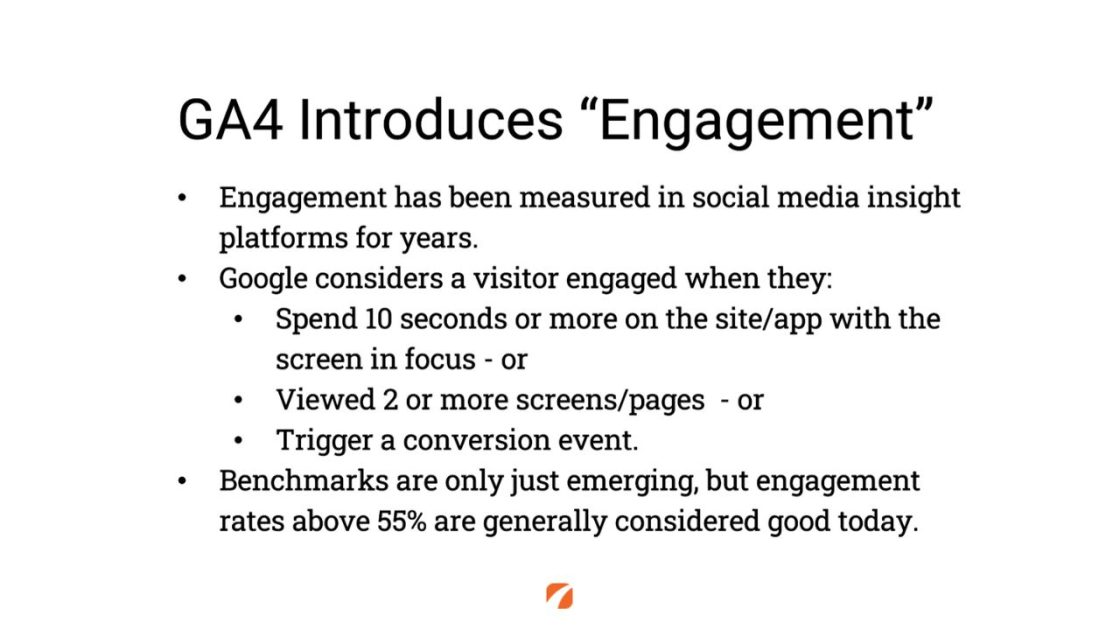
So, another big change here is the idea of engagement.
It won’t be a big change for those of you that are active in your social media marketing.
If you’ve looked at things like the Meta Insights Reporting, you’ve already seen, and you’re accustomed to talking about engaged users.
Google is adding the idea of engagement, but they’re defining it in their own very unique way. And they have to, in order to qualify as an engaged user, meet one of these three criteria.
Either they stay on your site for 10 seconds, uninterrupted without leaving and, you know, going into looking at another browser or another app or another window.
Or they need to view two or more pages, and it’s a website screen if GA4 is installed in an app.
Or they need to trigger a conversion event. Because imagine this scenario: somebody is looking for you, they find your website, they arrive at your website on mobile, they click to call, and do all of that in under two seconds. Well, in the old UA world, that would not be an engaged user, that would be a bounce because they hit one page and they left. In GA4 land, I think we would all agree, that’s actually a conversion, that person has initiated a phone call with your practice.
Right away, I think some of you are going to start thinking, well, what’s a good conversion rate at an individual page level? And there’s a lot of discussion on this topic online. I think there’s going to be a high degree of variability in how you define ‘good’ based on the variability in that third point that you see on your screen, which is what events are you considering to be conversion events. But, those that are talking about it online are already pegging 55% as a pretty good engagement rate in general.
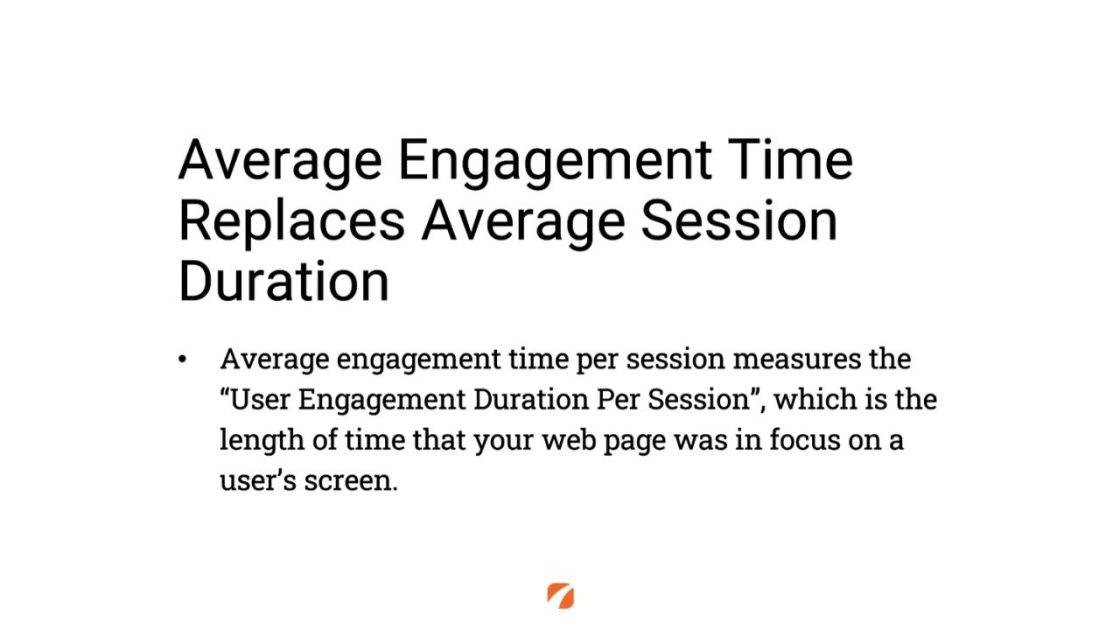
For those that are really focused on their average session duration, the thing to keep in mind is that’s going away. It’s now going to be called average engagement time, which looks at and focuses much more on when the user is actually paying attention to either your web page or your app. As opposed to just staying on the site, whether or not they actually are focused on that screen.
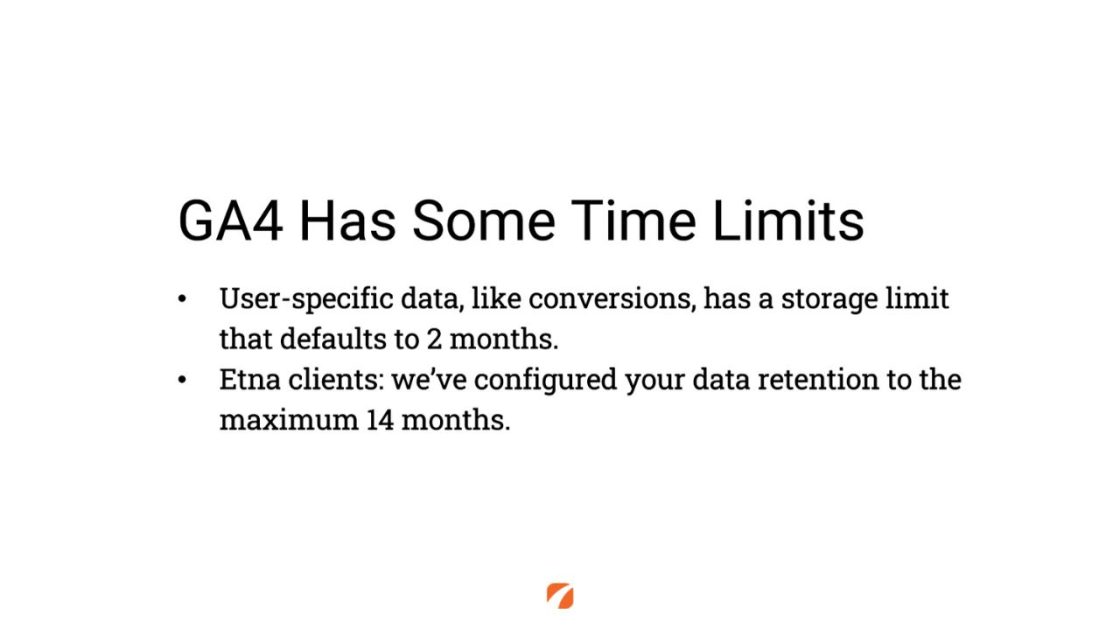
It is important to note as well that GA4 has some time limits that are different from the old UA.
Specifically, user-specific data like conversion events—that thing I’ve been talking about now for a little while—that data out of the box is only stored for two months.
For all of our clients, we are actually going in and changing it to the maximum possible data retention, which is 14 months of data. So, we’ll be able to do better year-over-year comparisons of how site performance is changing.
So that’s what I think you need to know at this phase about GA4.
Leave a Comment