

As a practice leader, determining whether or not your online marketing is making a difference for your practice can seem like a daunting task. However, there are a few simple benchmarks you can use to measure success and decide if your online marketing efforts are working, or perhaps need a little more attention.
In today’s blog, CEO Ryan Miller covers the benchmarks you will want to consider when evaluating your online marketing efforts. He also shares a valuable resource if you are interested in diving into your assessment a little deeper.
Video Transcription
Welcome back again, it’s Ryan Miller with Etna interactive and we’re here today to talk about online marketing benchmarks, now specifically if you’re a practice leader responsible for making decisions about your online marketing investments, you are probably are often cursed with the question:
“How do I know if my online marketing is actually working?”
Now most of you know how to measure performance in local search and organic search, like what we see here on the map.
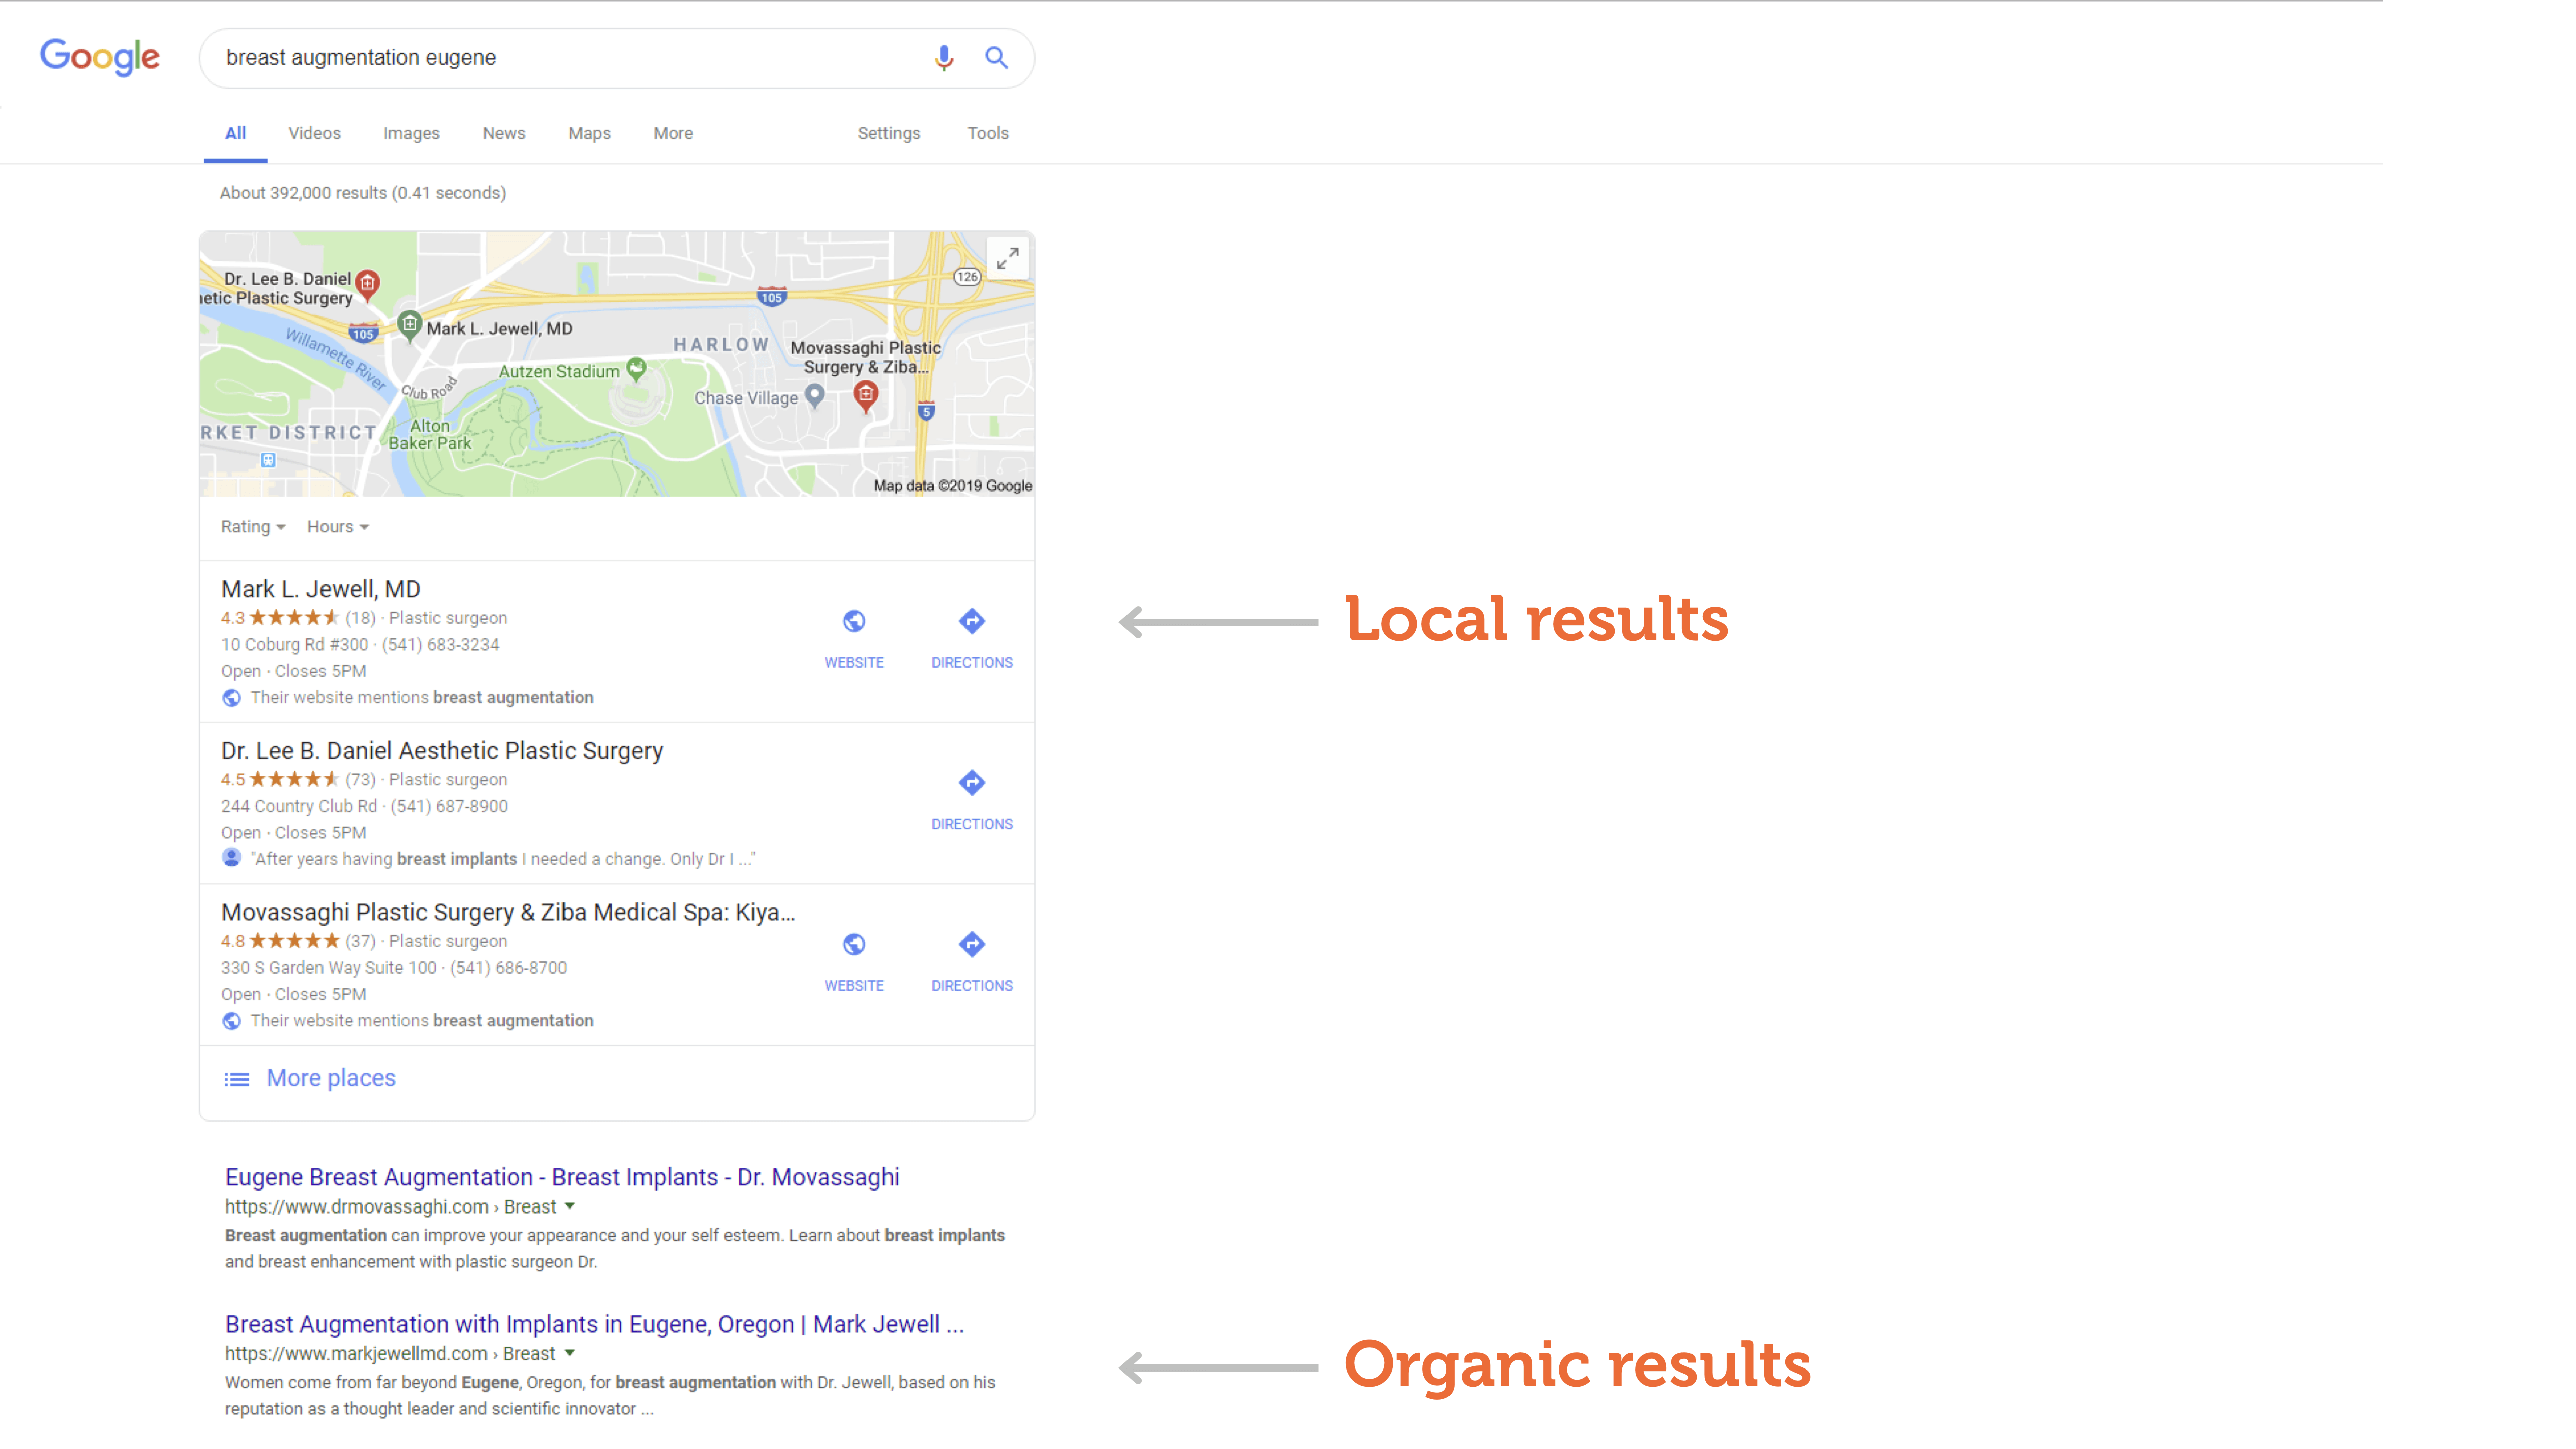
Local search is the top of the screen, organic search is the bottom of the screen, both of these are results on Google and we know, either we’re on the first page or we’re not on the first page. But when we start looking at other channels we have to ask, “Well how would we actually measure performance?”
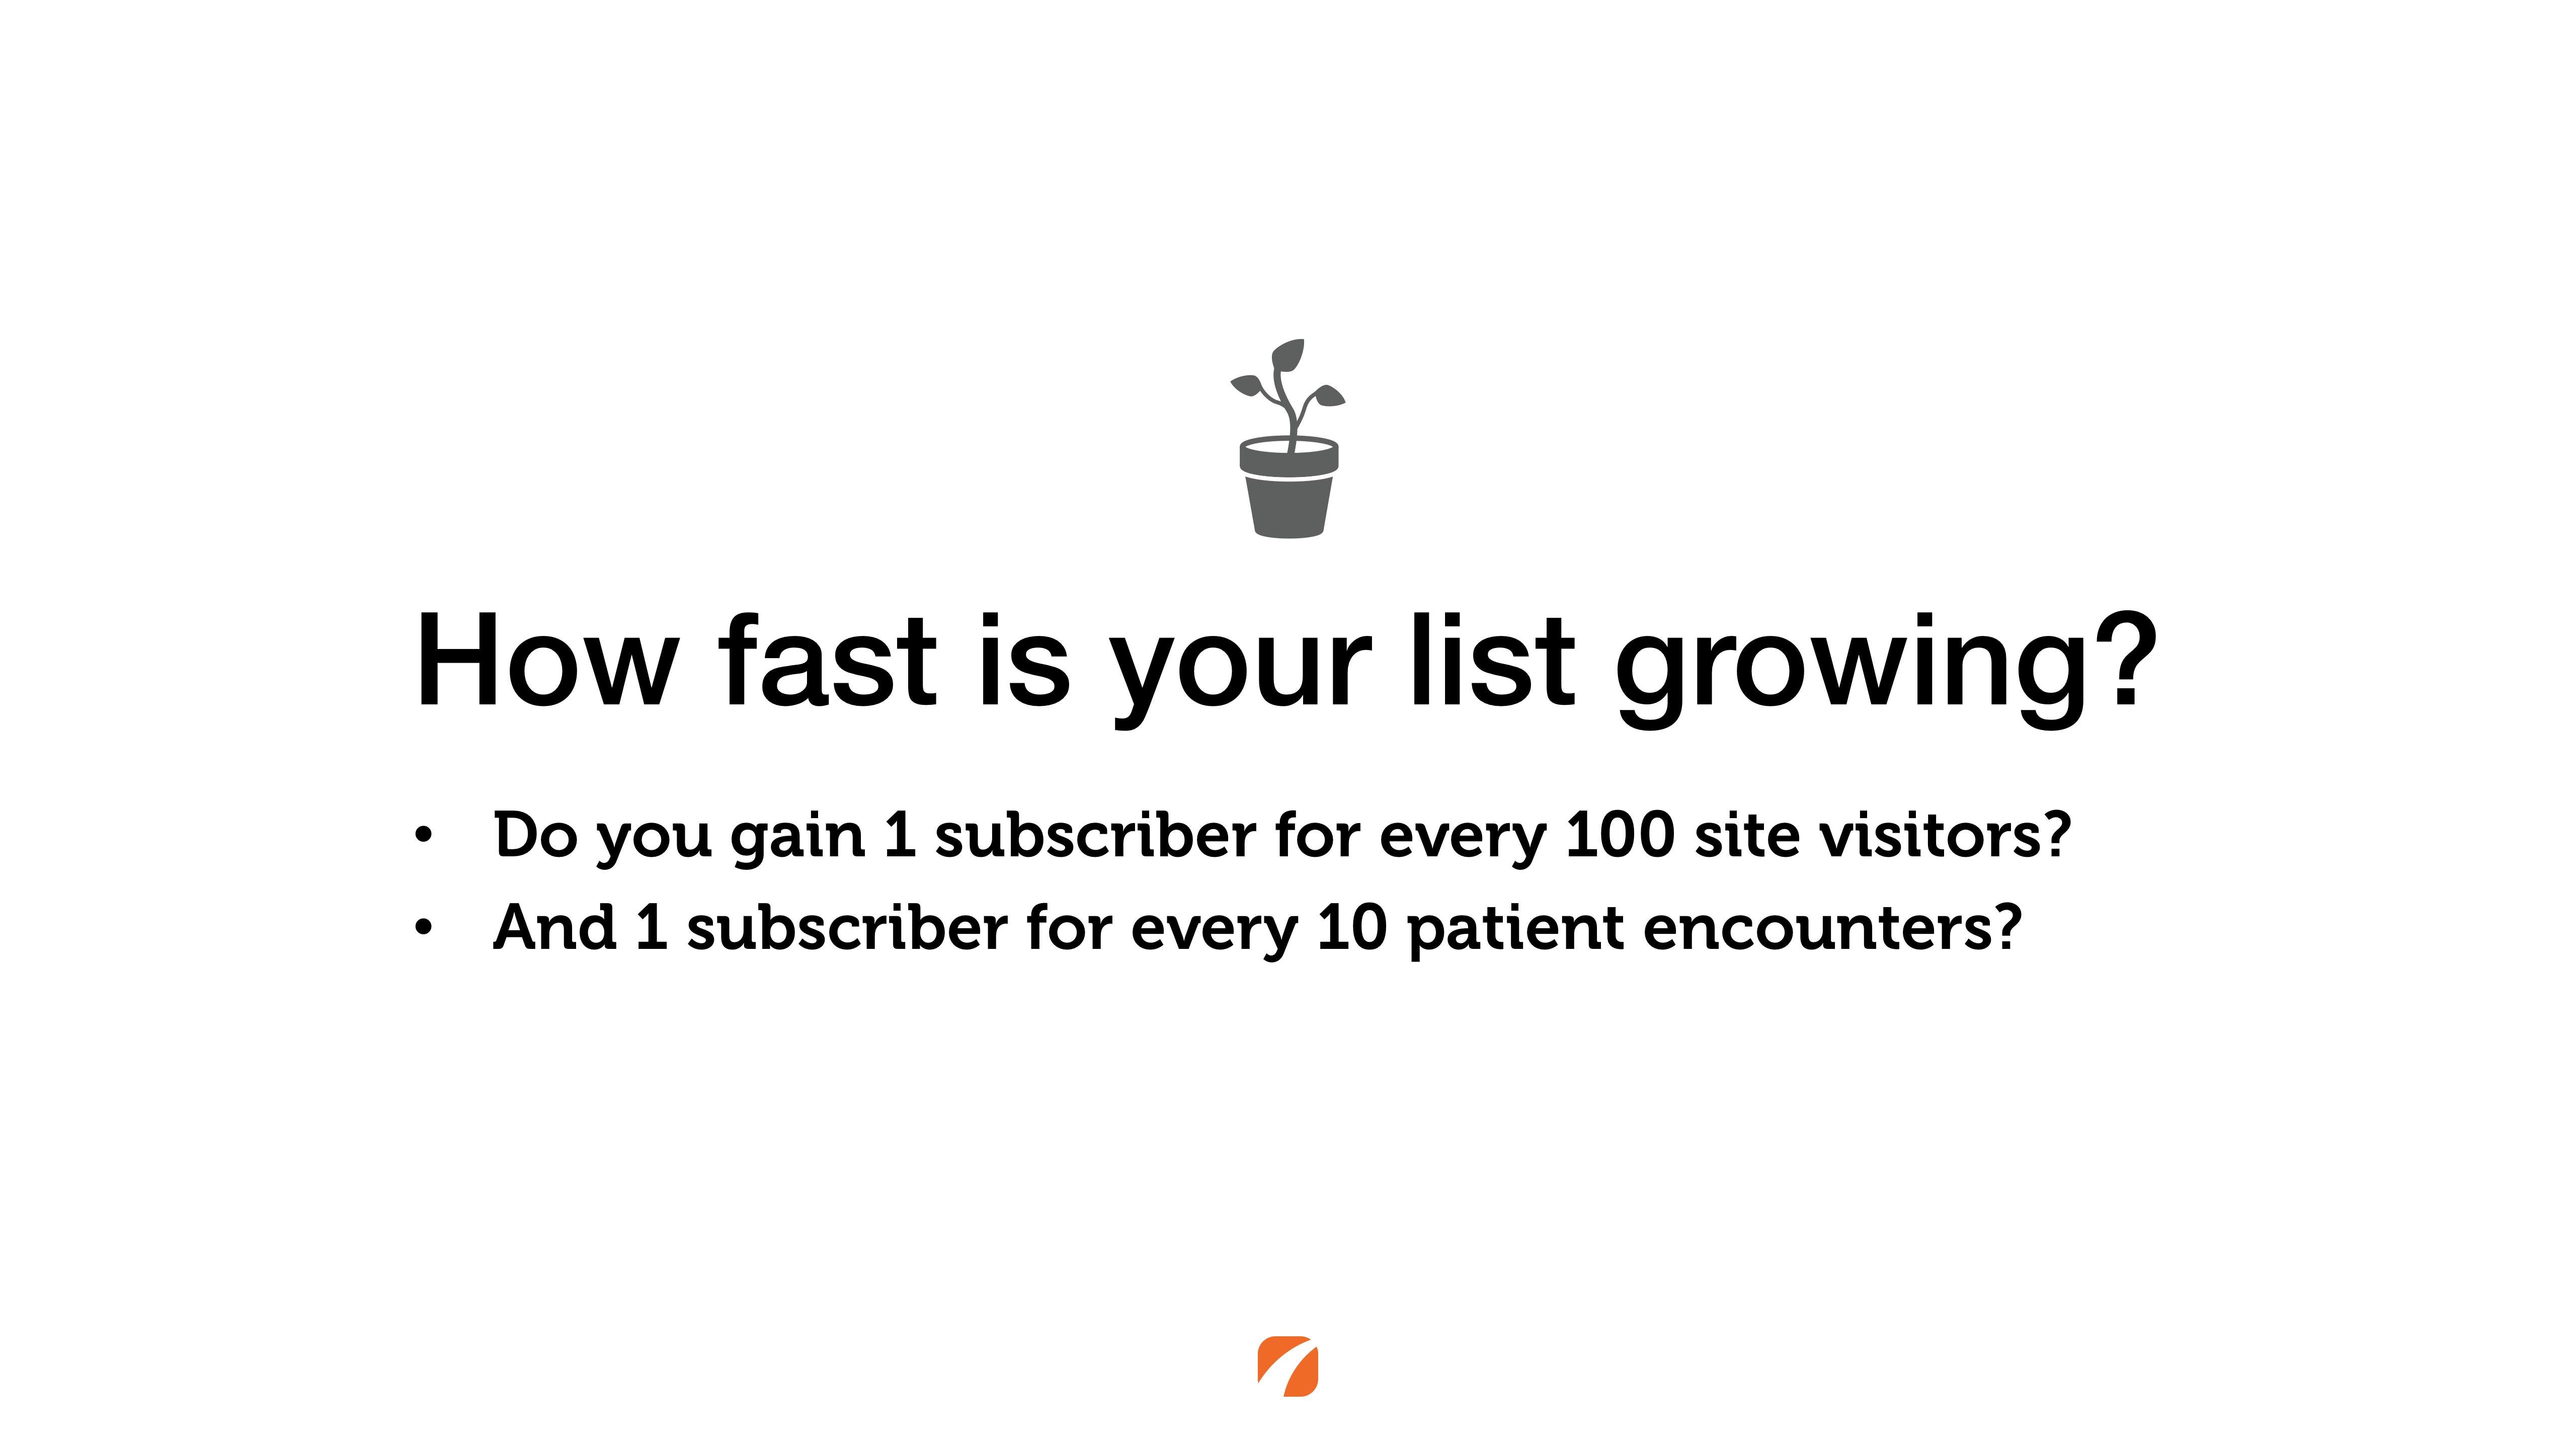
Let’s talk first about email marketing. Now we’ve covered this in the past but we had some really good questions come back, specifically about these first benchmarks. Why do we look at two different benchmarks for list growth? Well the main reason is this; I’m often surprised by how many clinics completely fail to focus on growing their list either in the practice, or they fail to connect their website to their newsletter subscription software. So these two benchmarks here, looking about 1 in every 100 site visitors being added to your list, and 1 in every 10 patient encounters making it onto your list helps you to focus on both of the areas where you might grow your list.
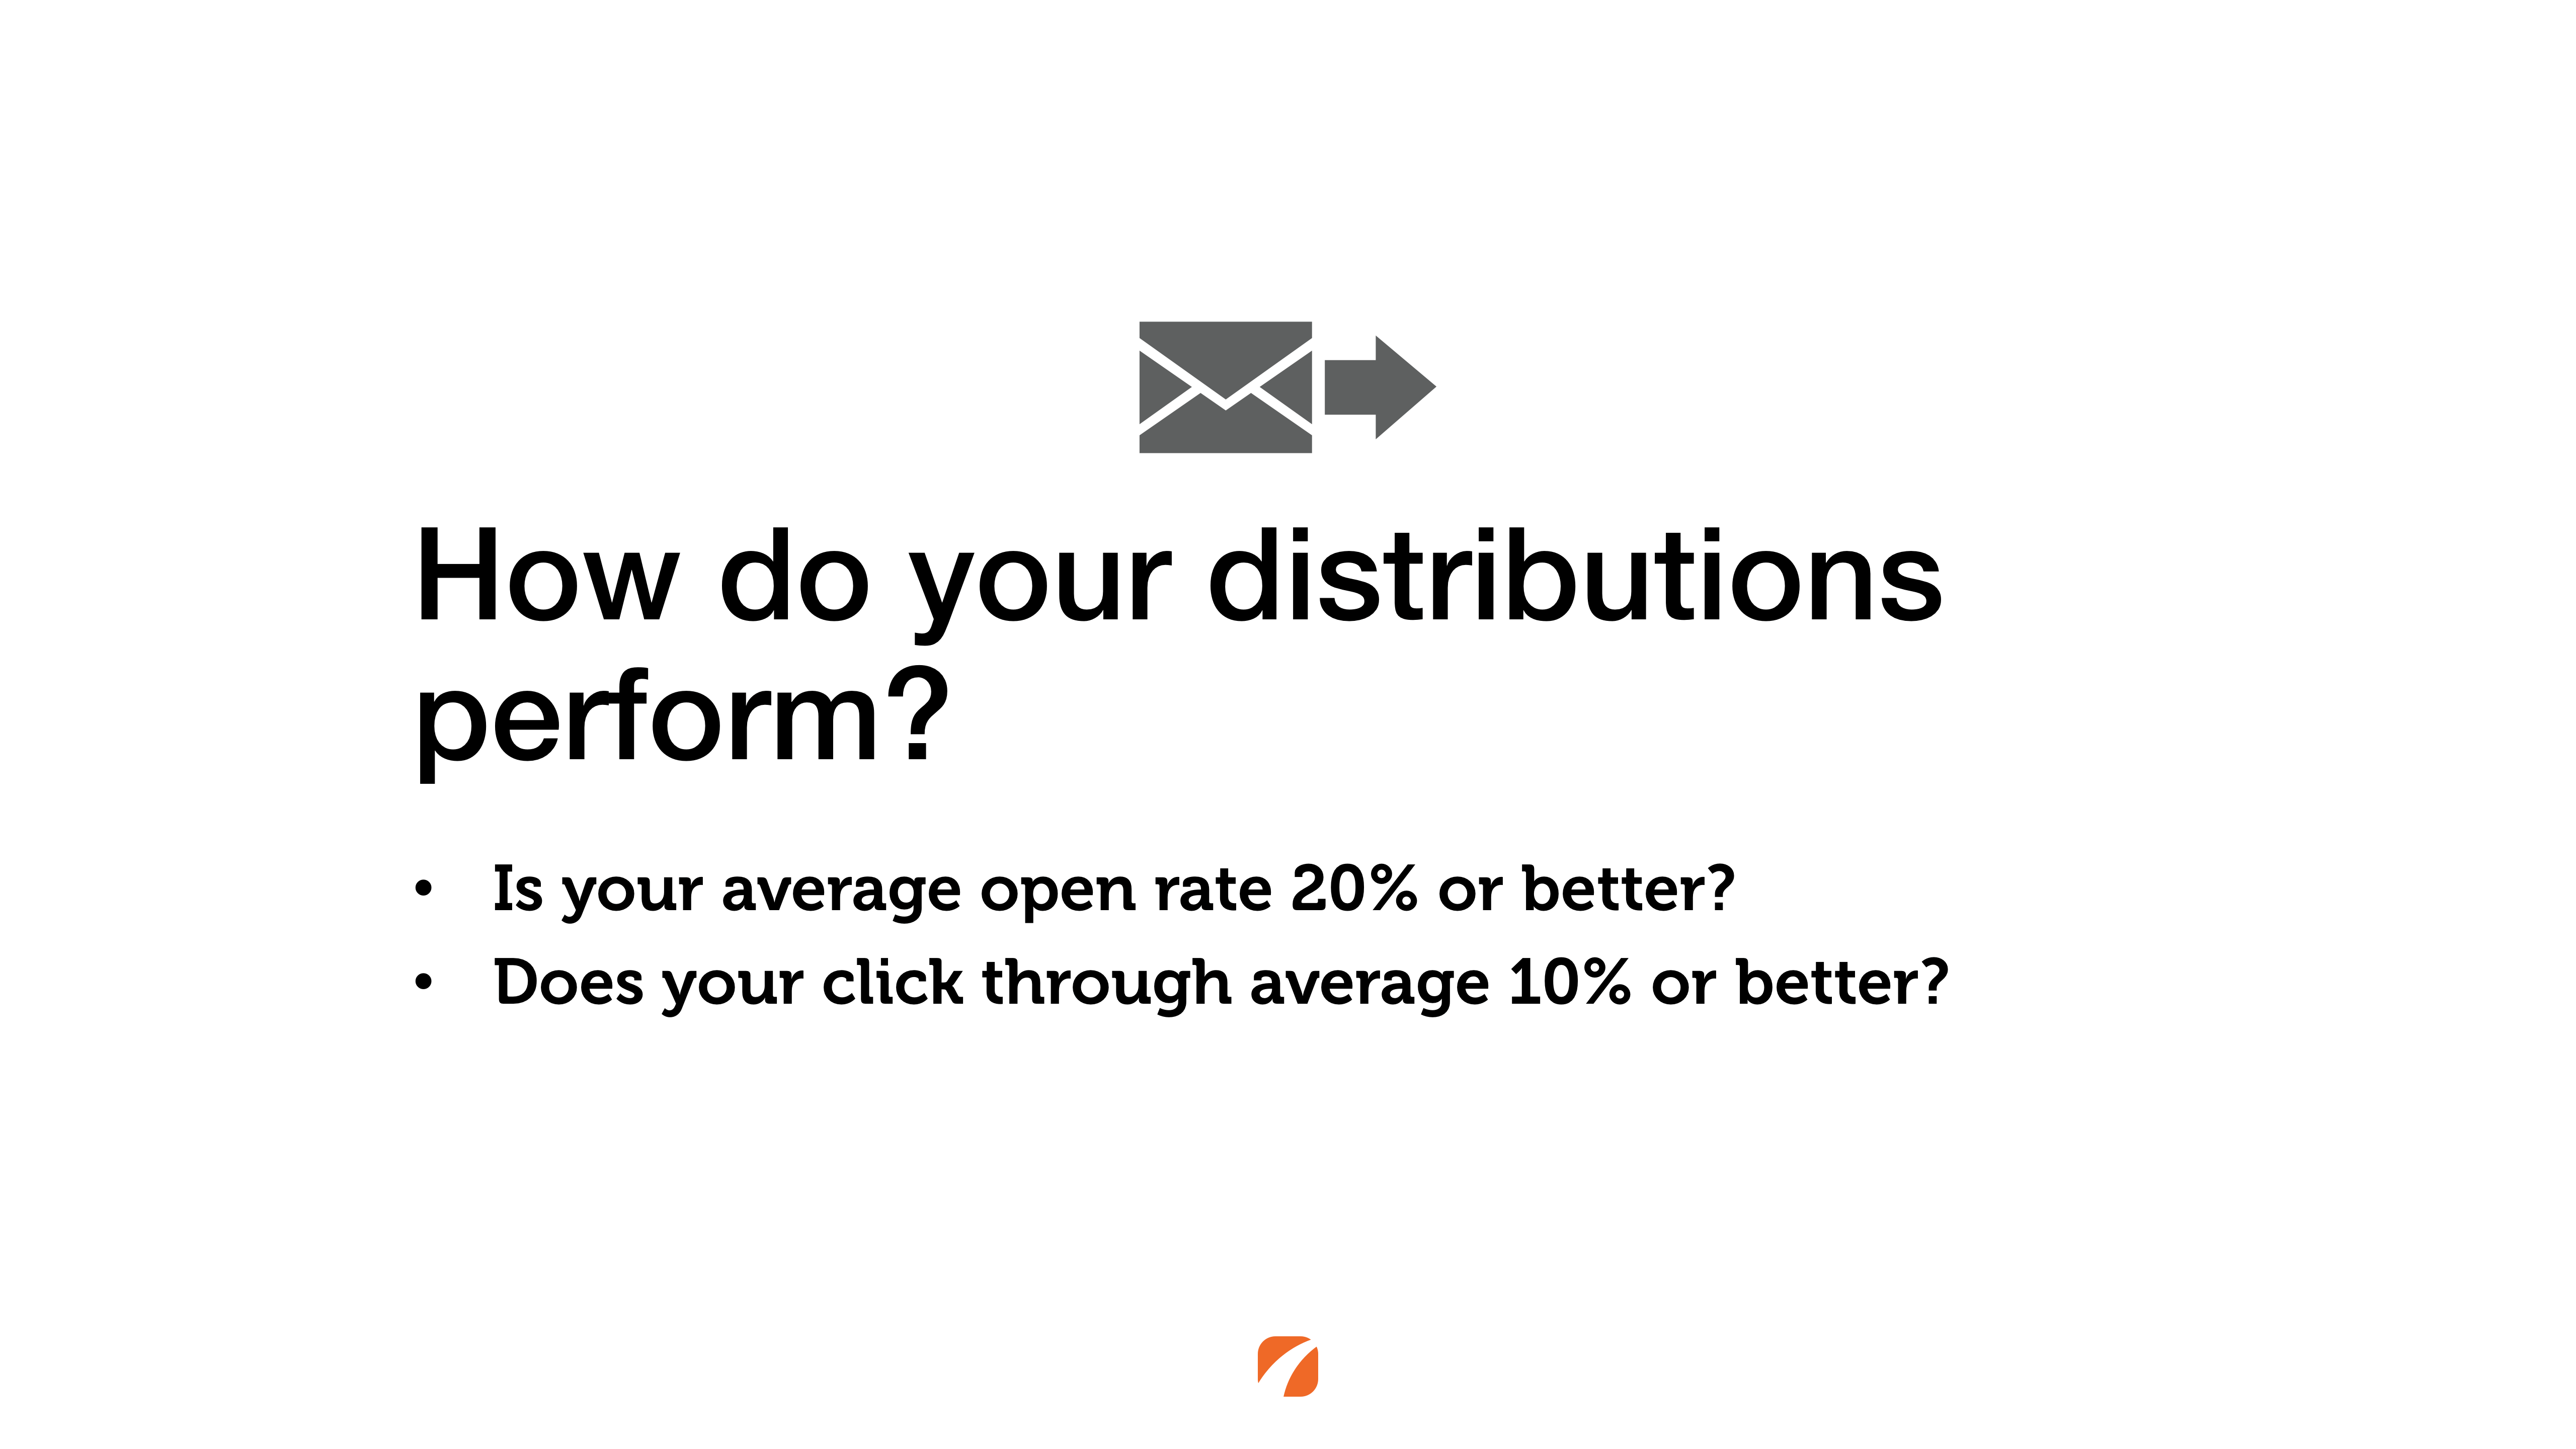
And the two benchmarks that you want to look at, how would you even see these? Ask your team if you use something like Constant Contact or MailChimp, if you use software for customer relationship management like Solutionreach or Demandforce for your email. Look at the legacy, the log of all of your past campaigns, look and open rate and click through and if your numbers are consistently below 20/10 well that’s the time where you and your team need to talk about improving your email marketing.
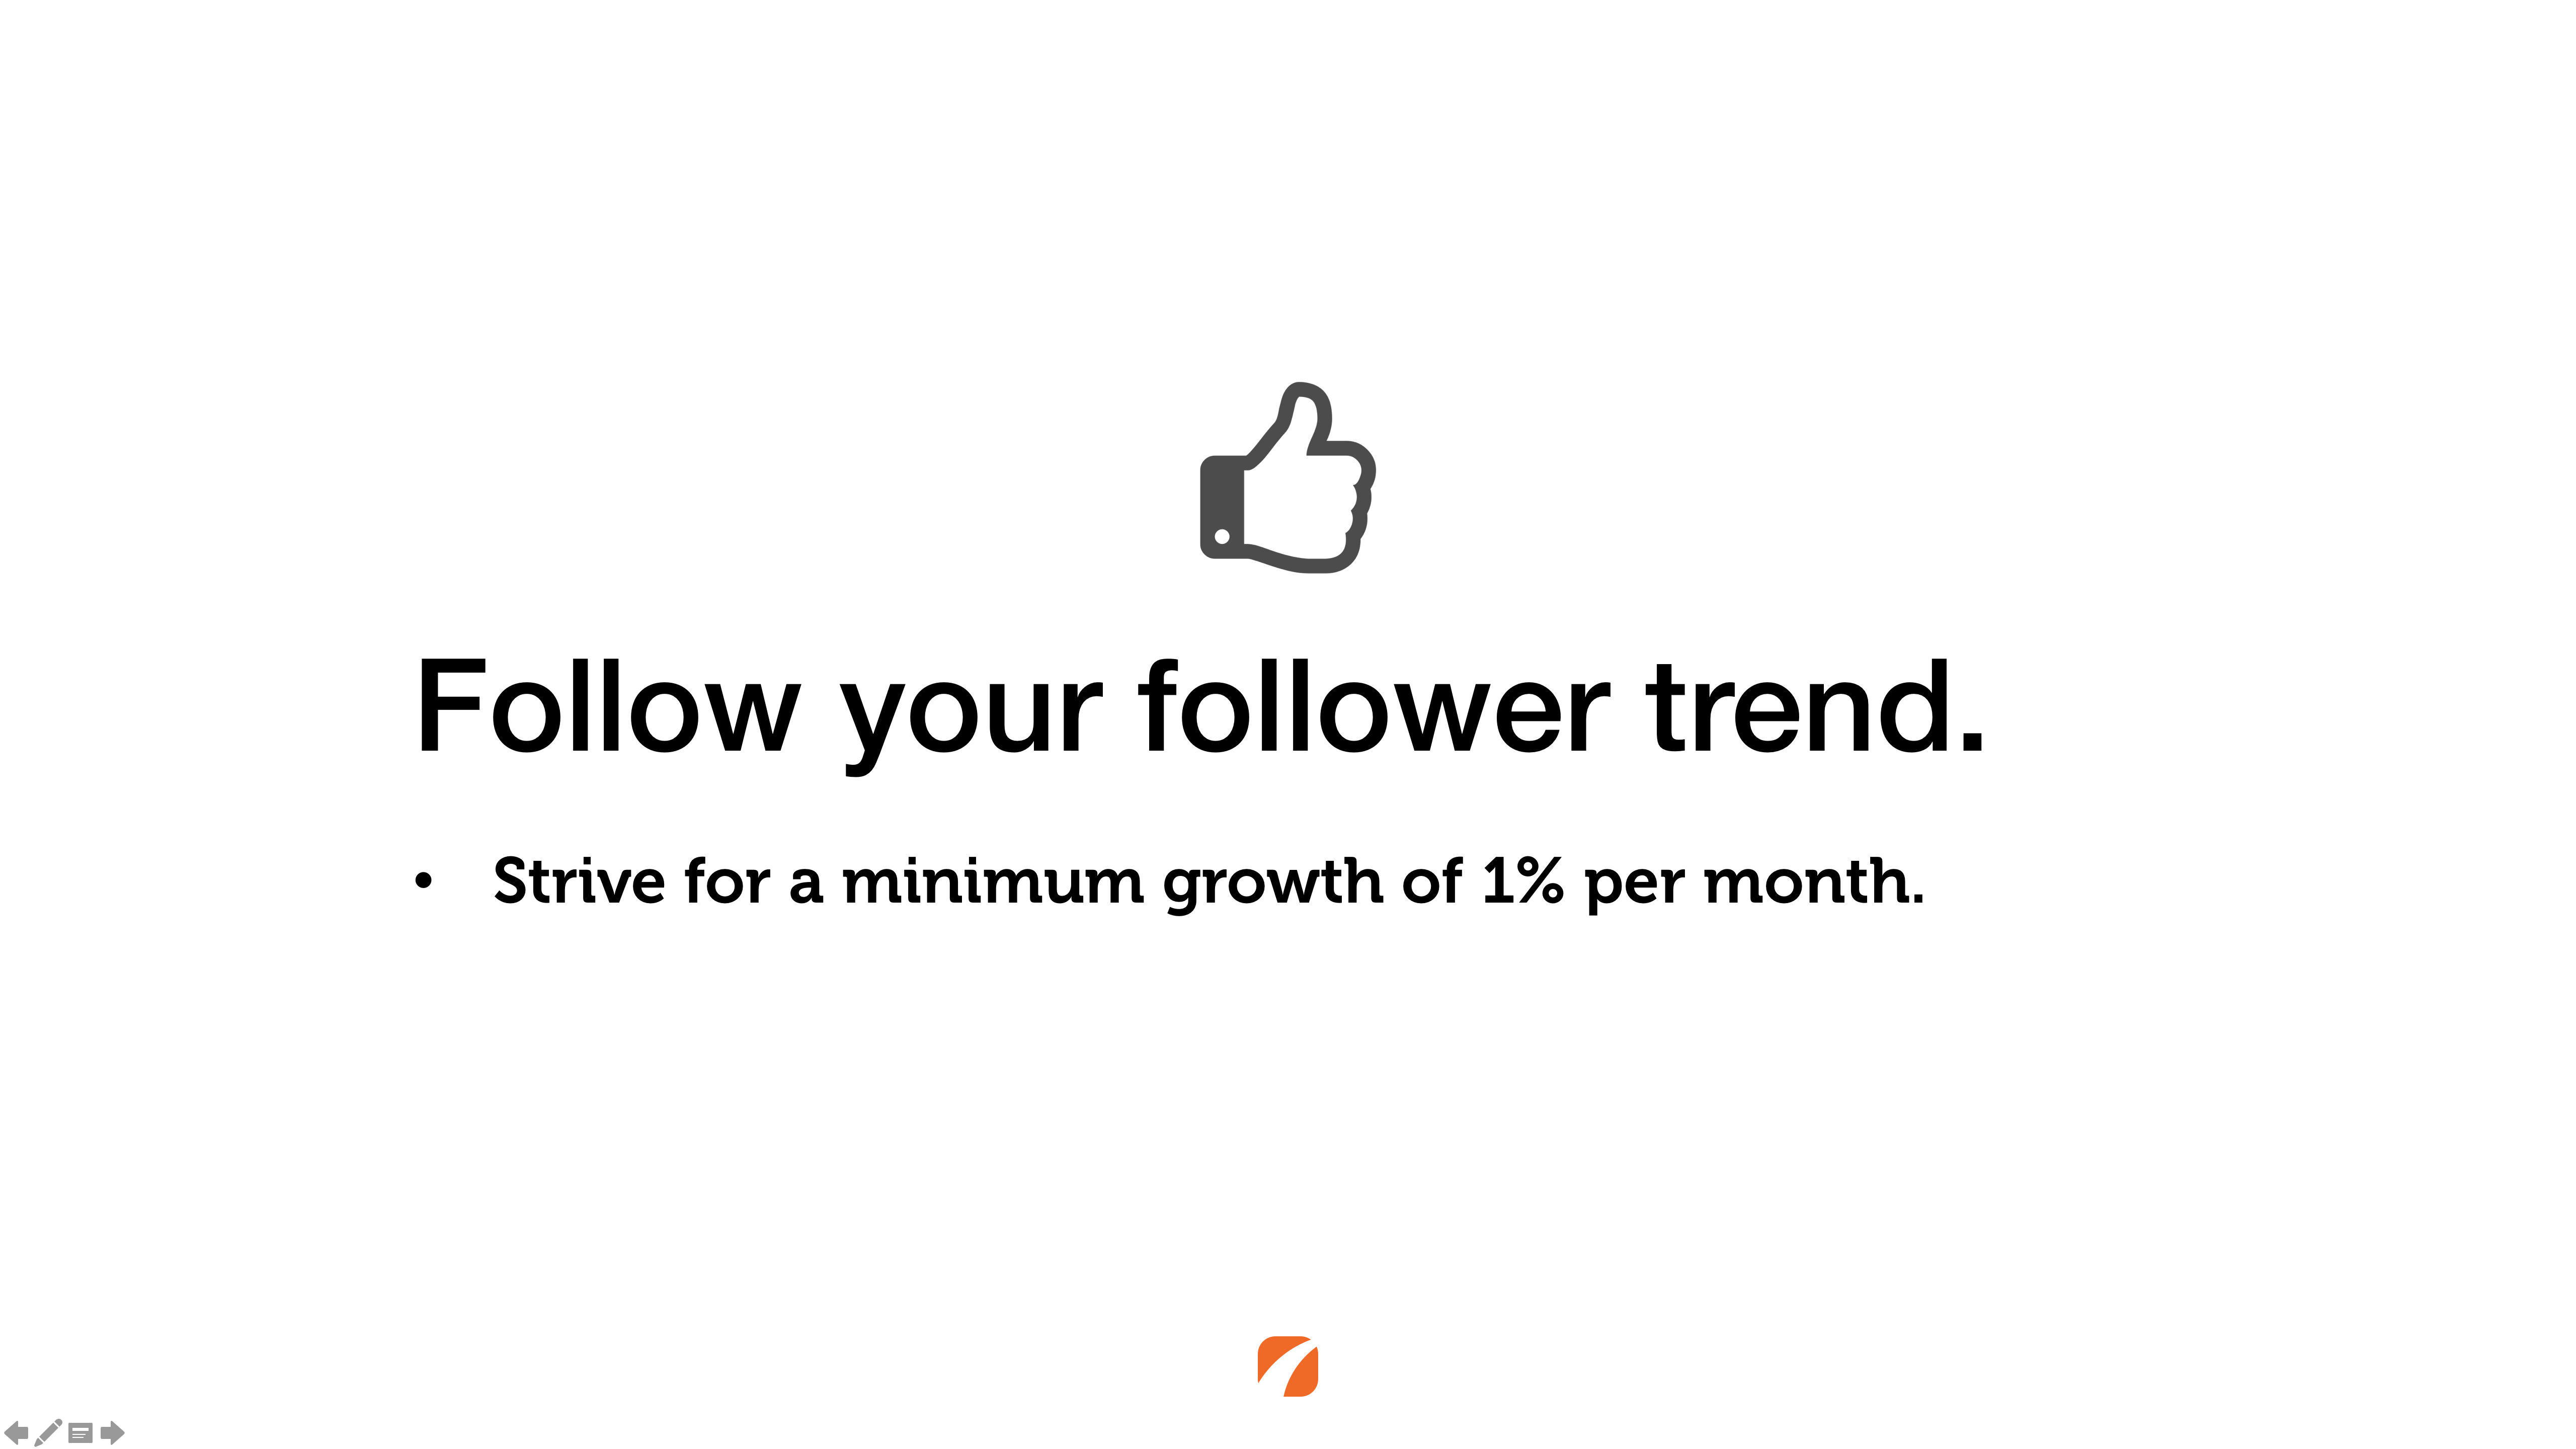
Now what about social media? It’s certainly a little bit harder to measure performance in social media. The first thing we want to look at is the follower trend, and this is something you can easily see by logging in to either Facebook or Instagram and looking at what’s called your insights control panel. The reports that are there on insights are going to allow you to see the trend in follower growth over time. Now, when we look at the two platforms there is some variation here; Facebook growth has been trending down, not as many people are signing onto Facebook although it is still growing as a platform, while Instagram is taking off. On average though when we look across the two platforms, if you’re not a social media celebrity, well 1% growth rate month over month is a healthy growth rate for most aesthetic clinics.
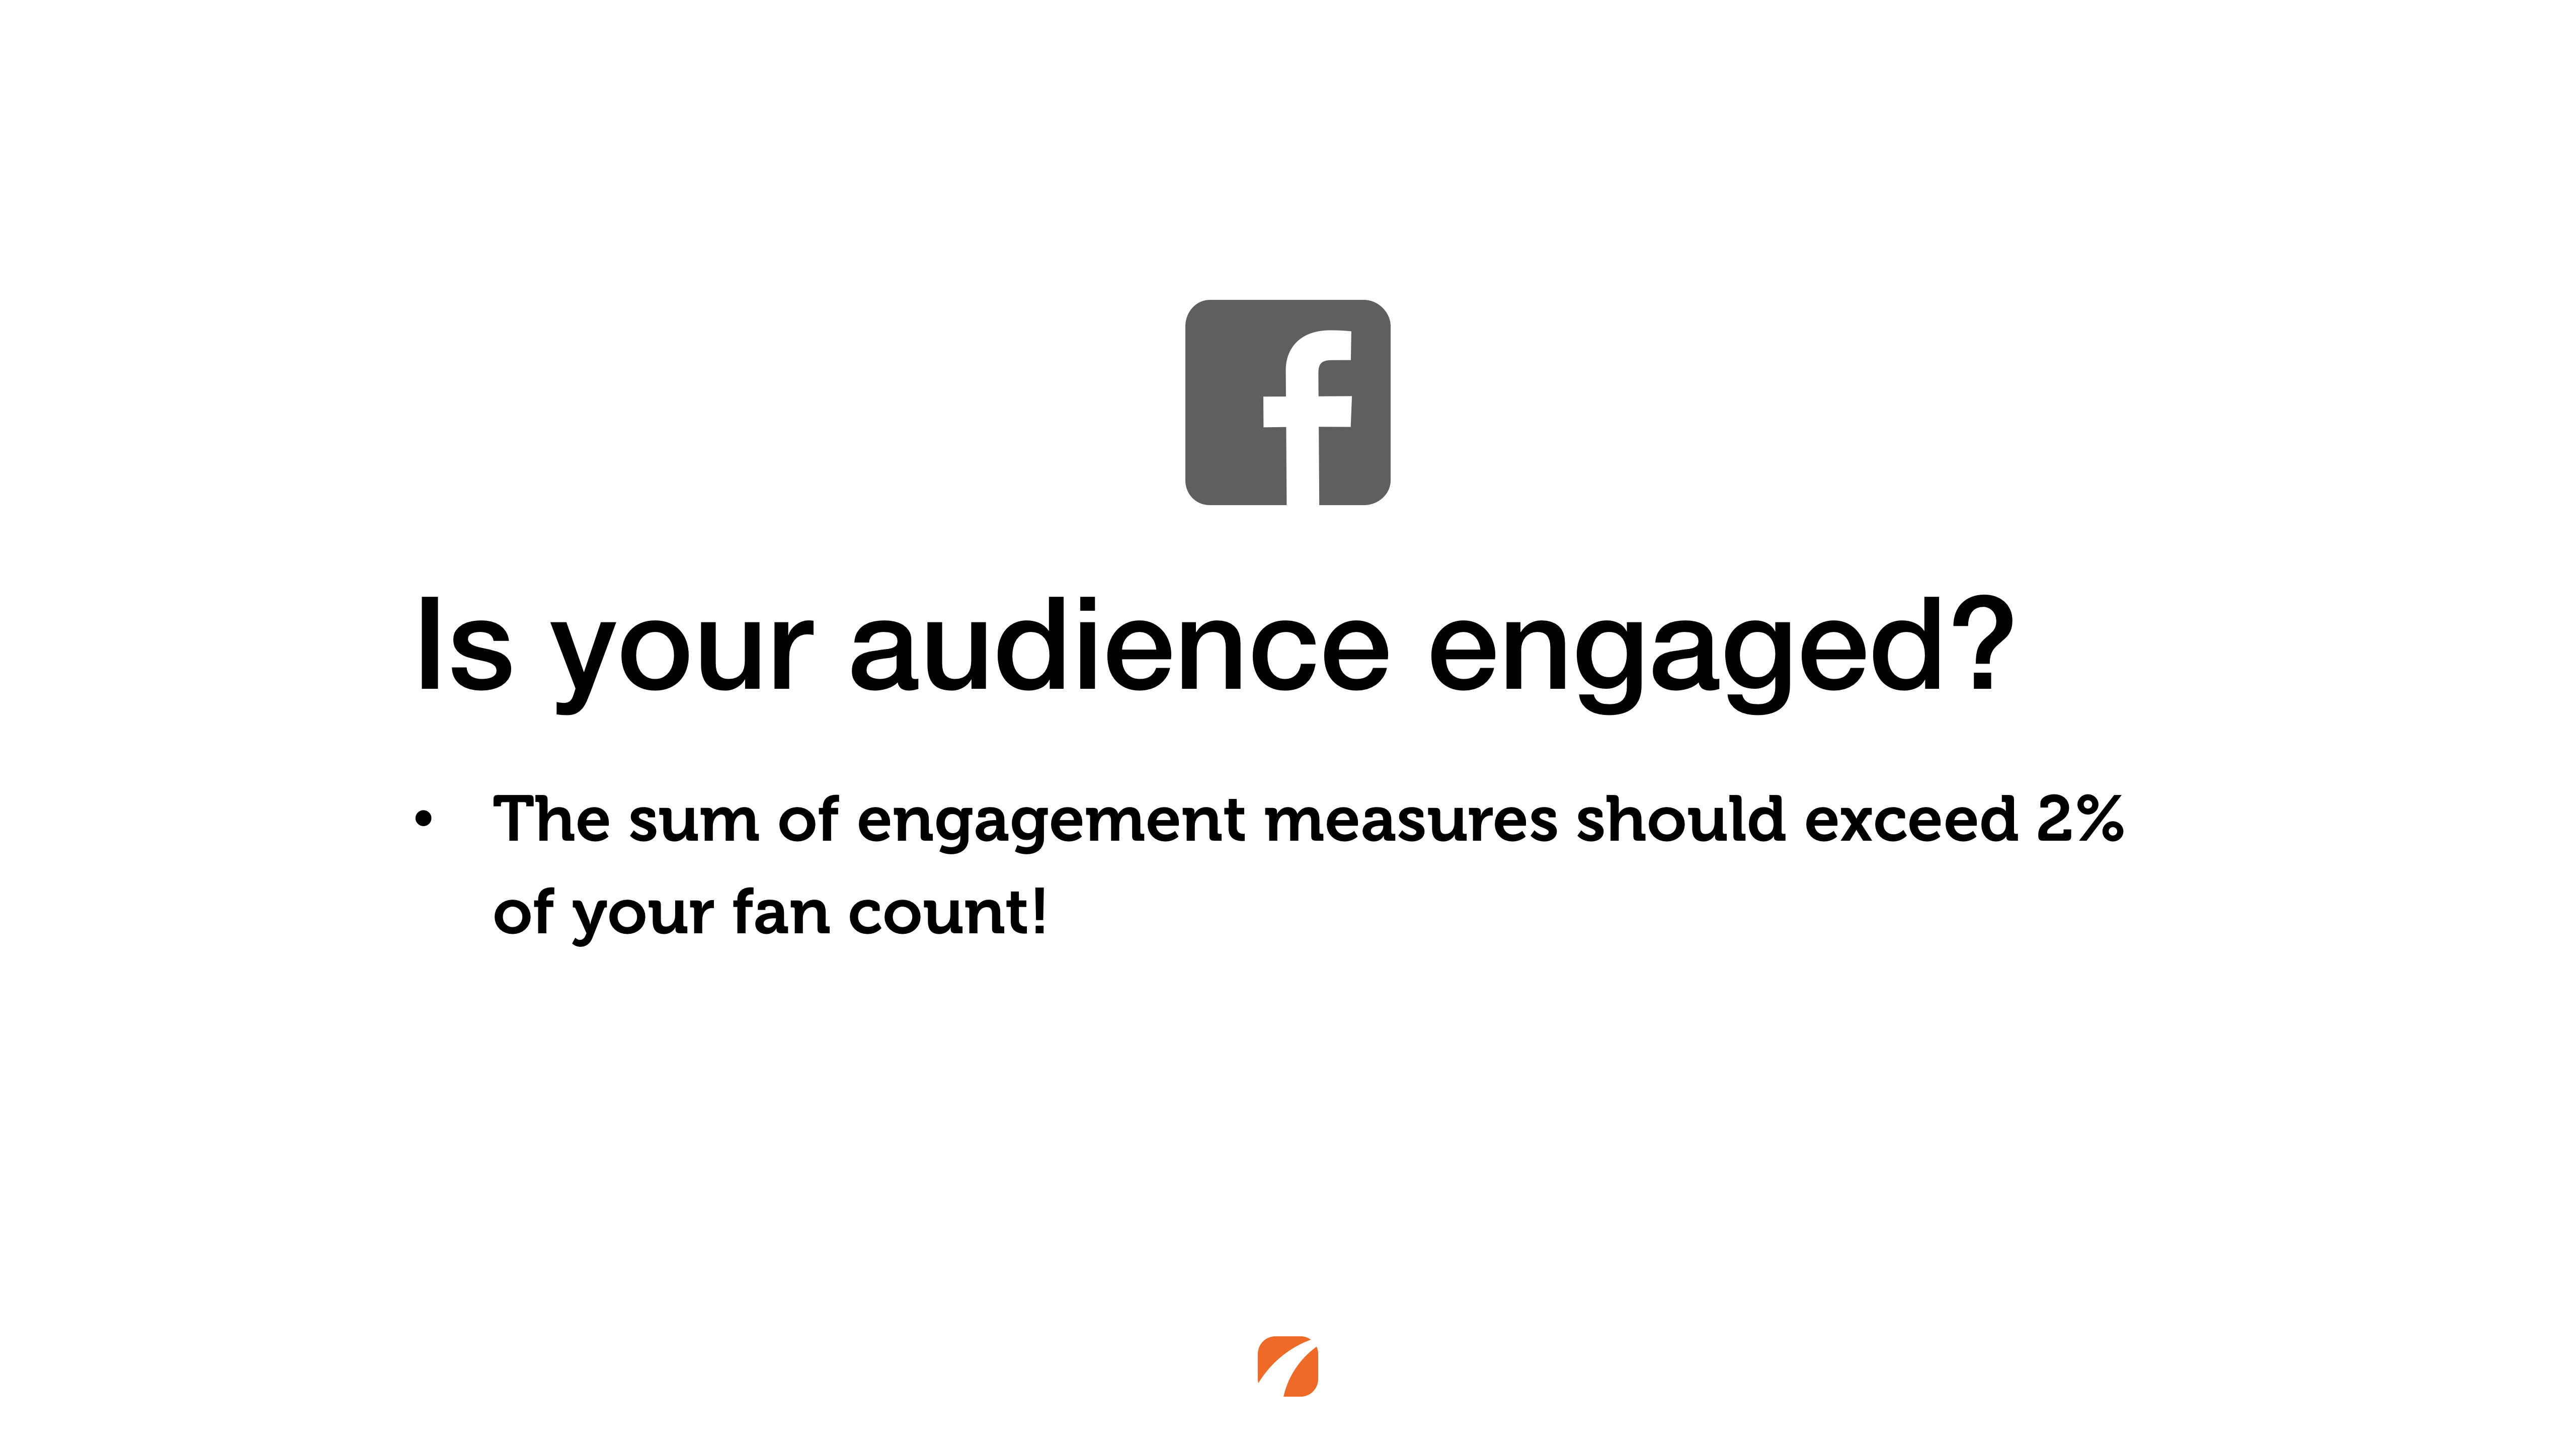
Now, audience engagement is something else that you can look at and for this you don’t even need to go into the back end of the reporting for either Facebook or Instagram. What you want to do is take all of the signs of engagement. These might be people adding an emotional reaction, liking your post, sharing or commenting on that post. Take each one of those as a discreet activity, sum them together, and if on average you’re exceeding a 2% response rate, or 2% looks at the engagement divided by your total fan count, generally speaking you’re doing pretty well.
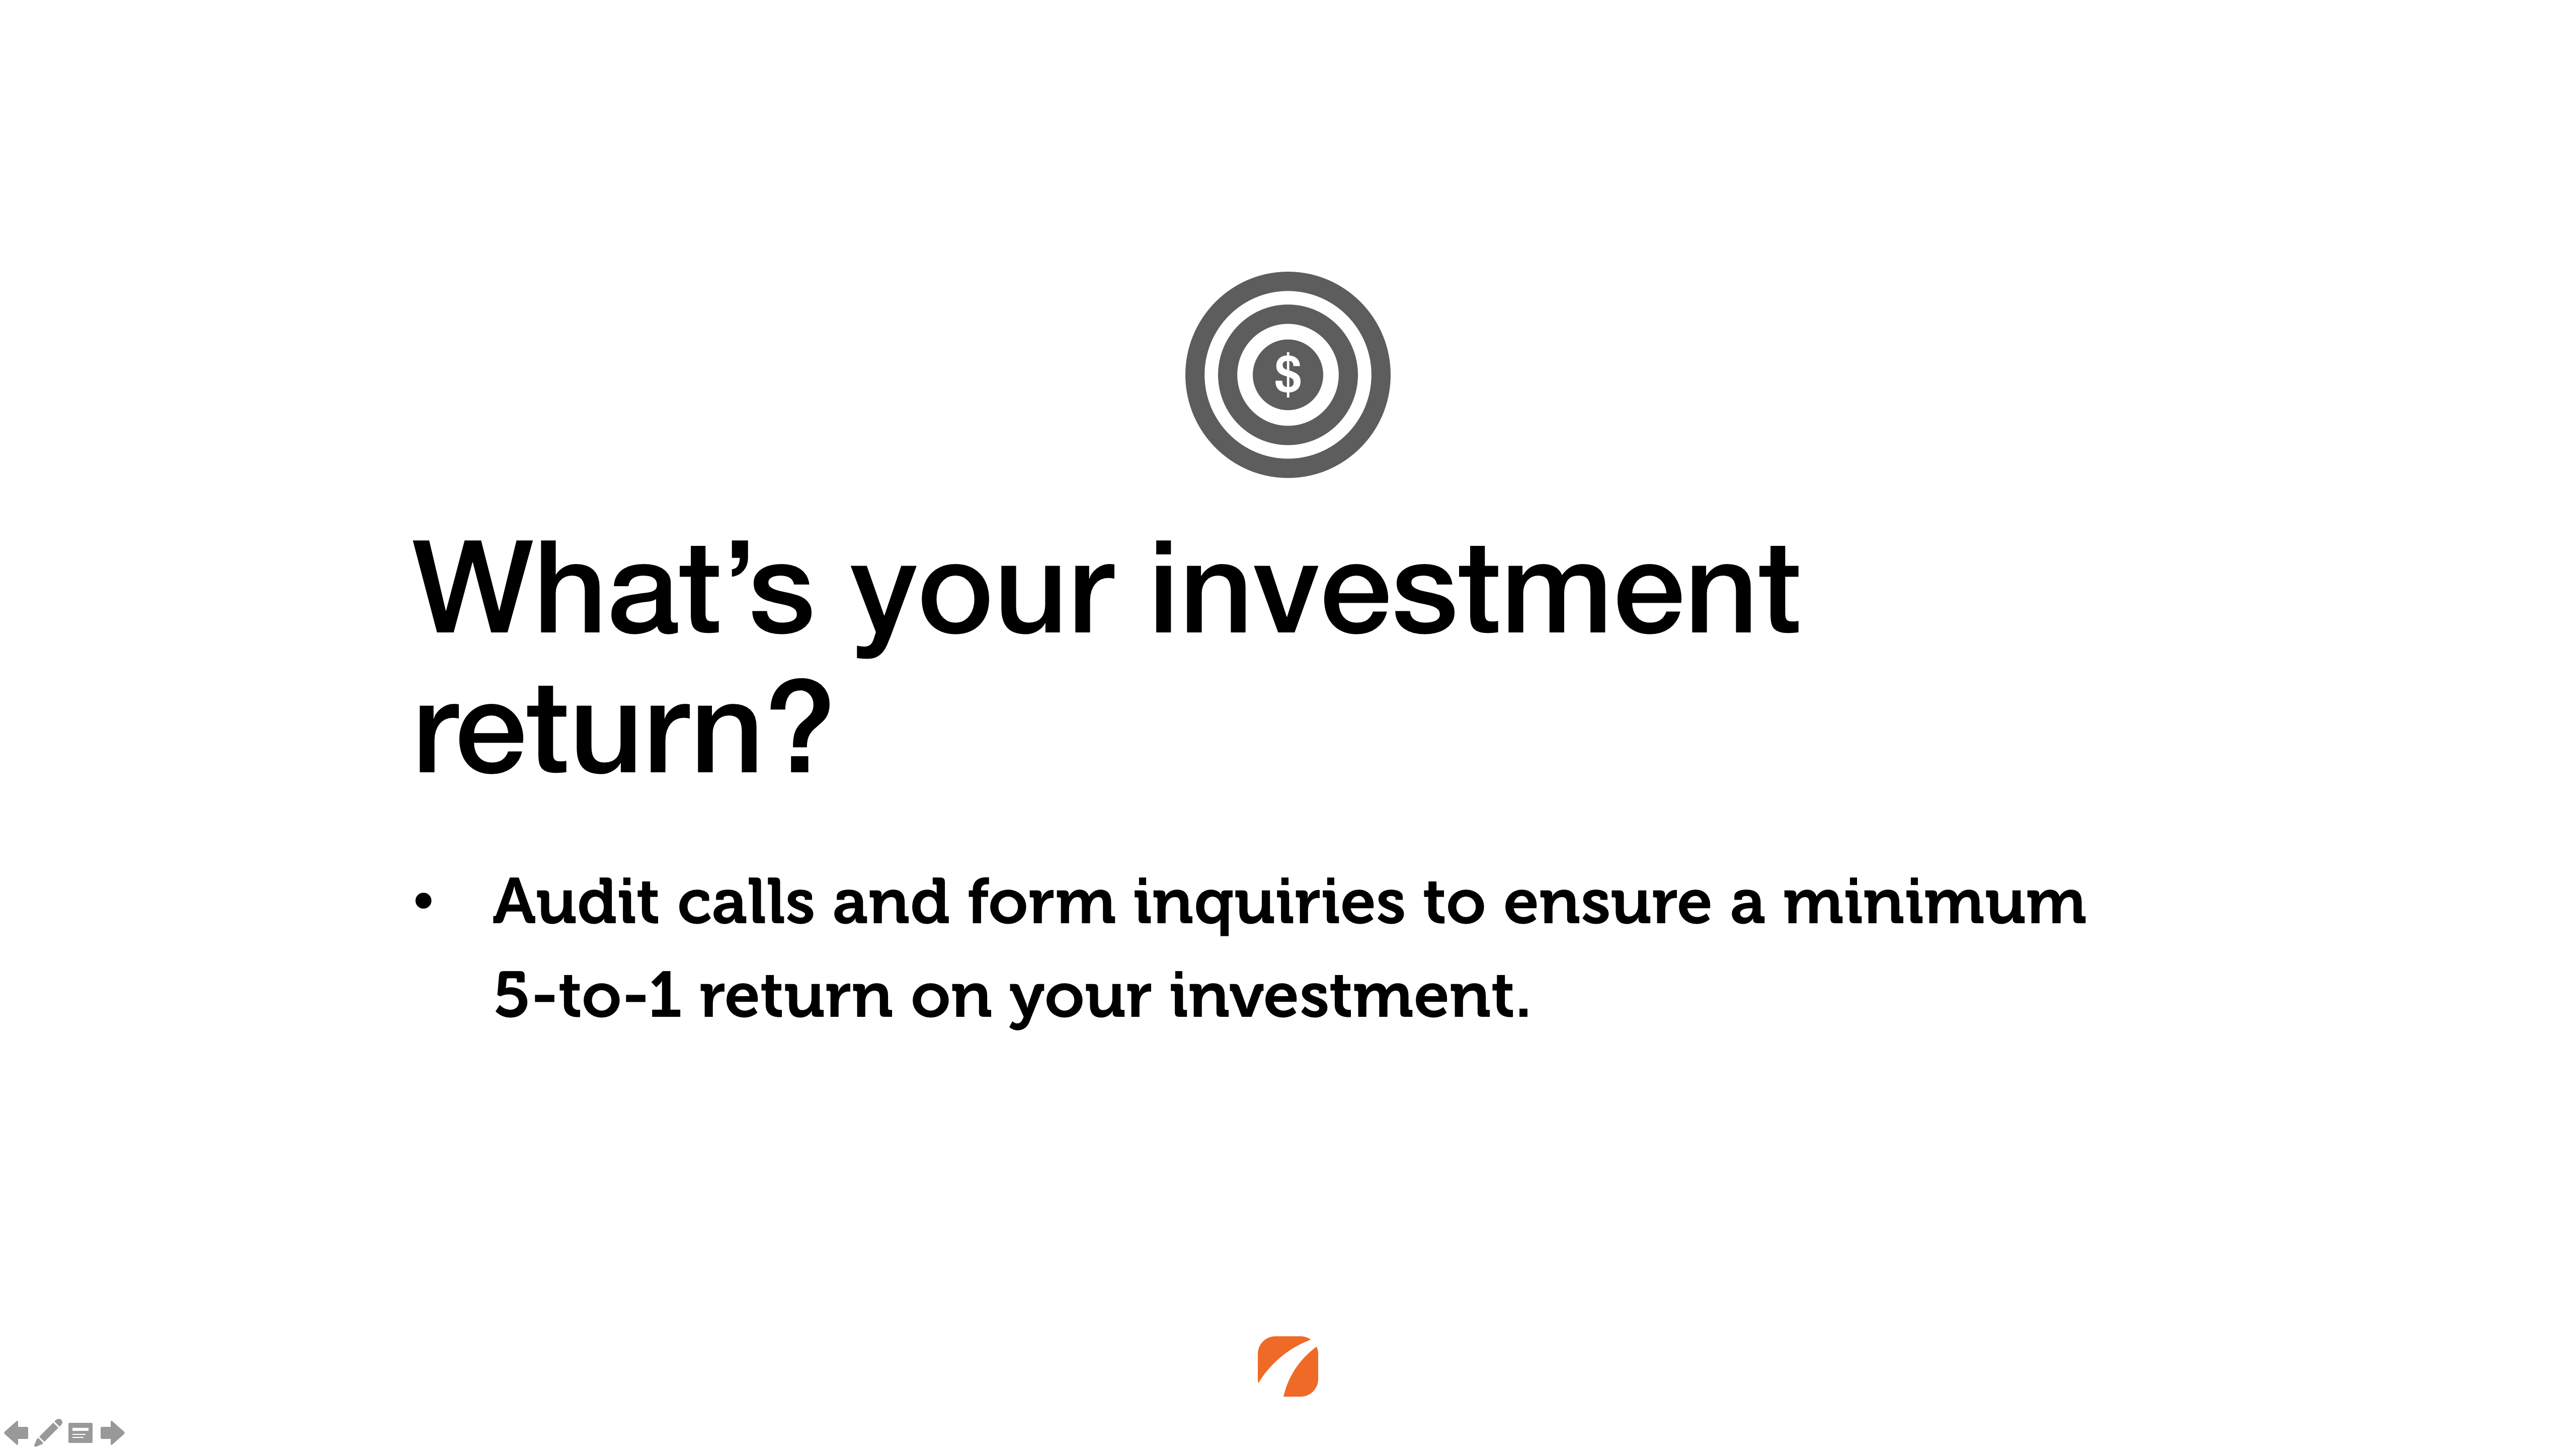
Now let’s talk about paid media, and I’ll tell you on this one, this is one that gets me all the time. When we hear from a perspective client that they’re actively engaged in pay per click advertising but they’re not actually measuring their investment return. In pay per click advertising in particular, well this is one of those areas where we can invest with certainty. So we need to step back and ideally set a threshold of how much you’re willing to tolerate in a ratio of investment to return. We recommend in general that if you can prove by auditing your form based leads, and your phone calls, that you’re making at least a 5-to-1 return on your investment, that you probably should keep things going with your pay per click, although never stop the conversations about how exactly we go about improving that investment return. If it’s under 5-to-1 well then it’s time to have a serious conversation about whether or not the platform is viable for the long term.
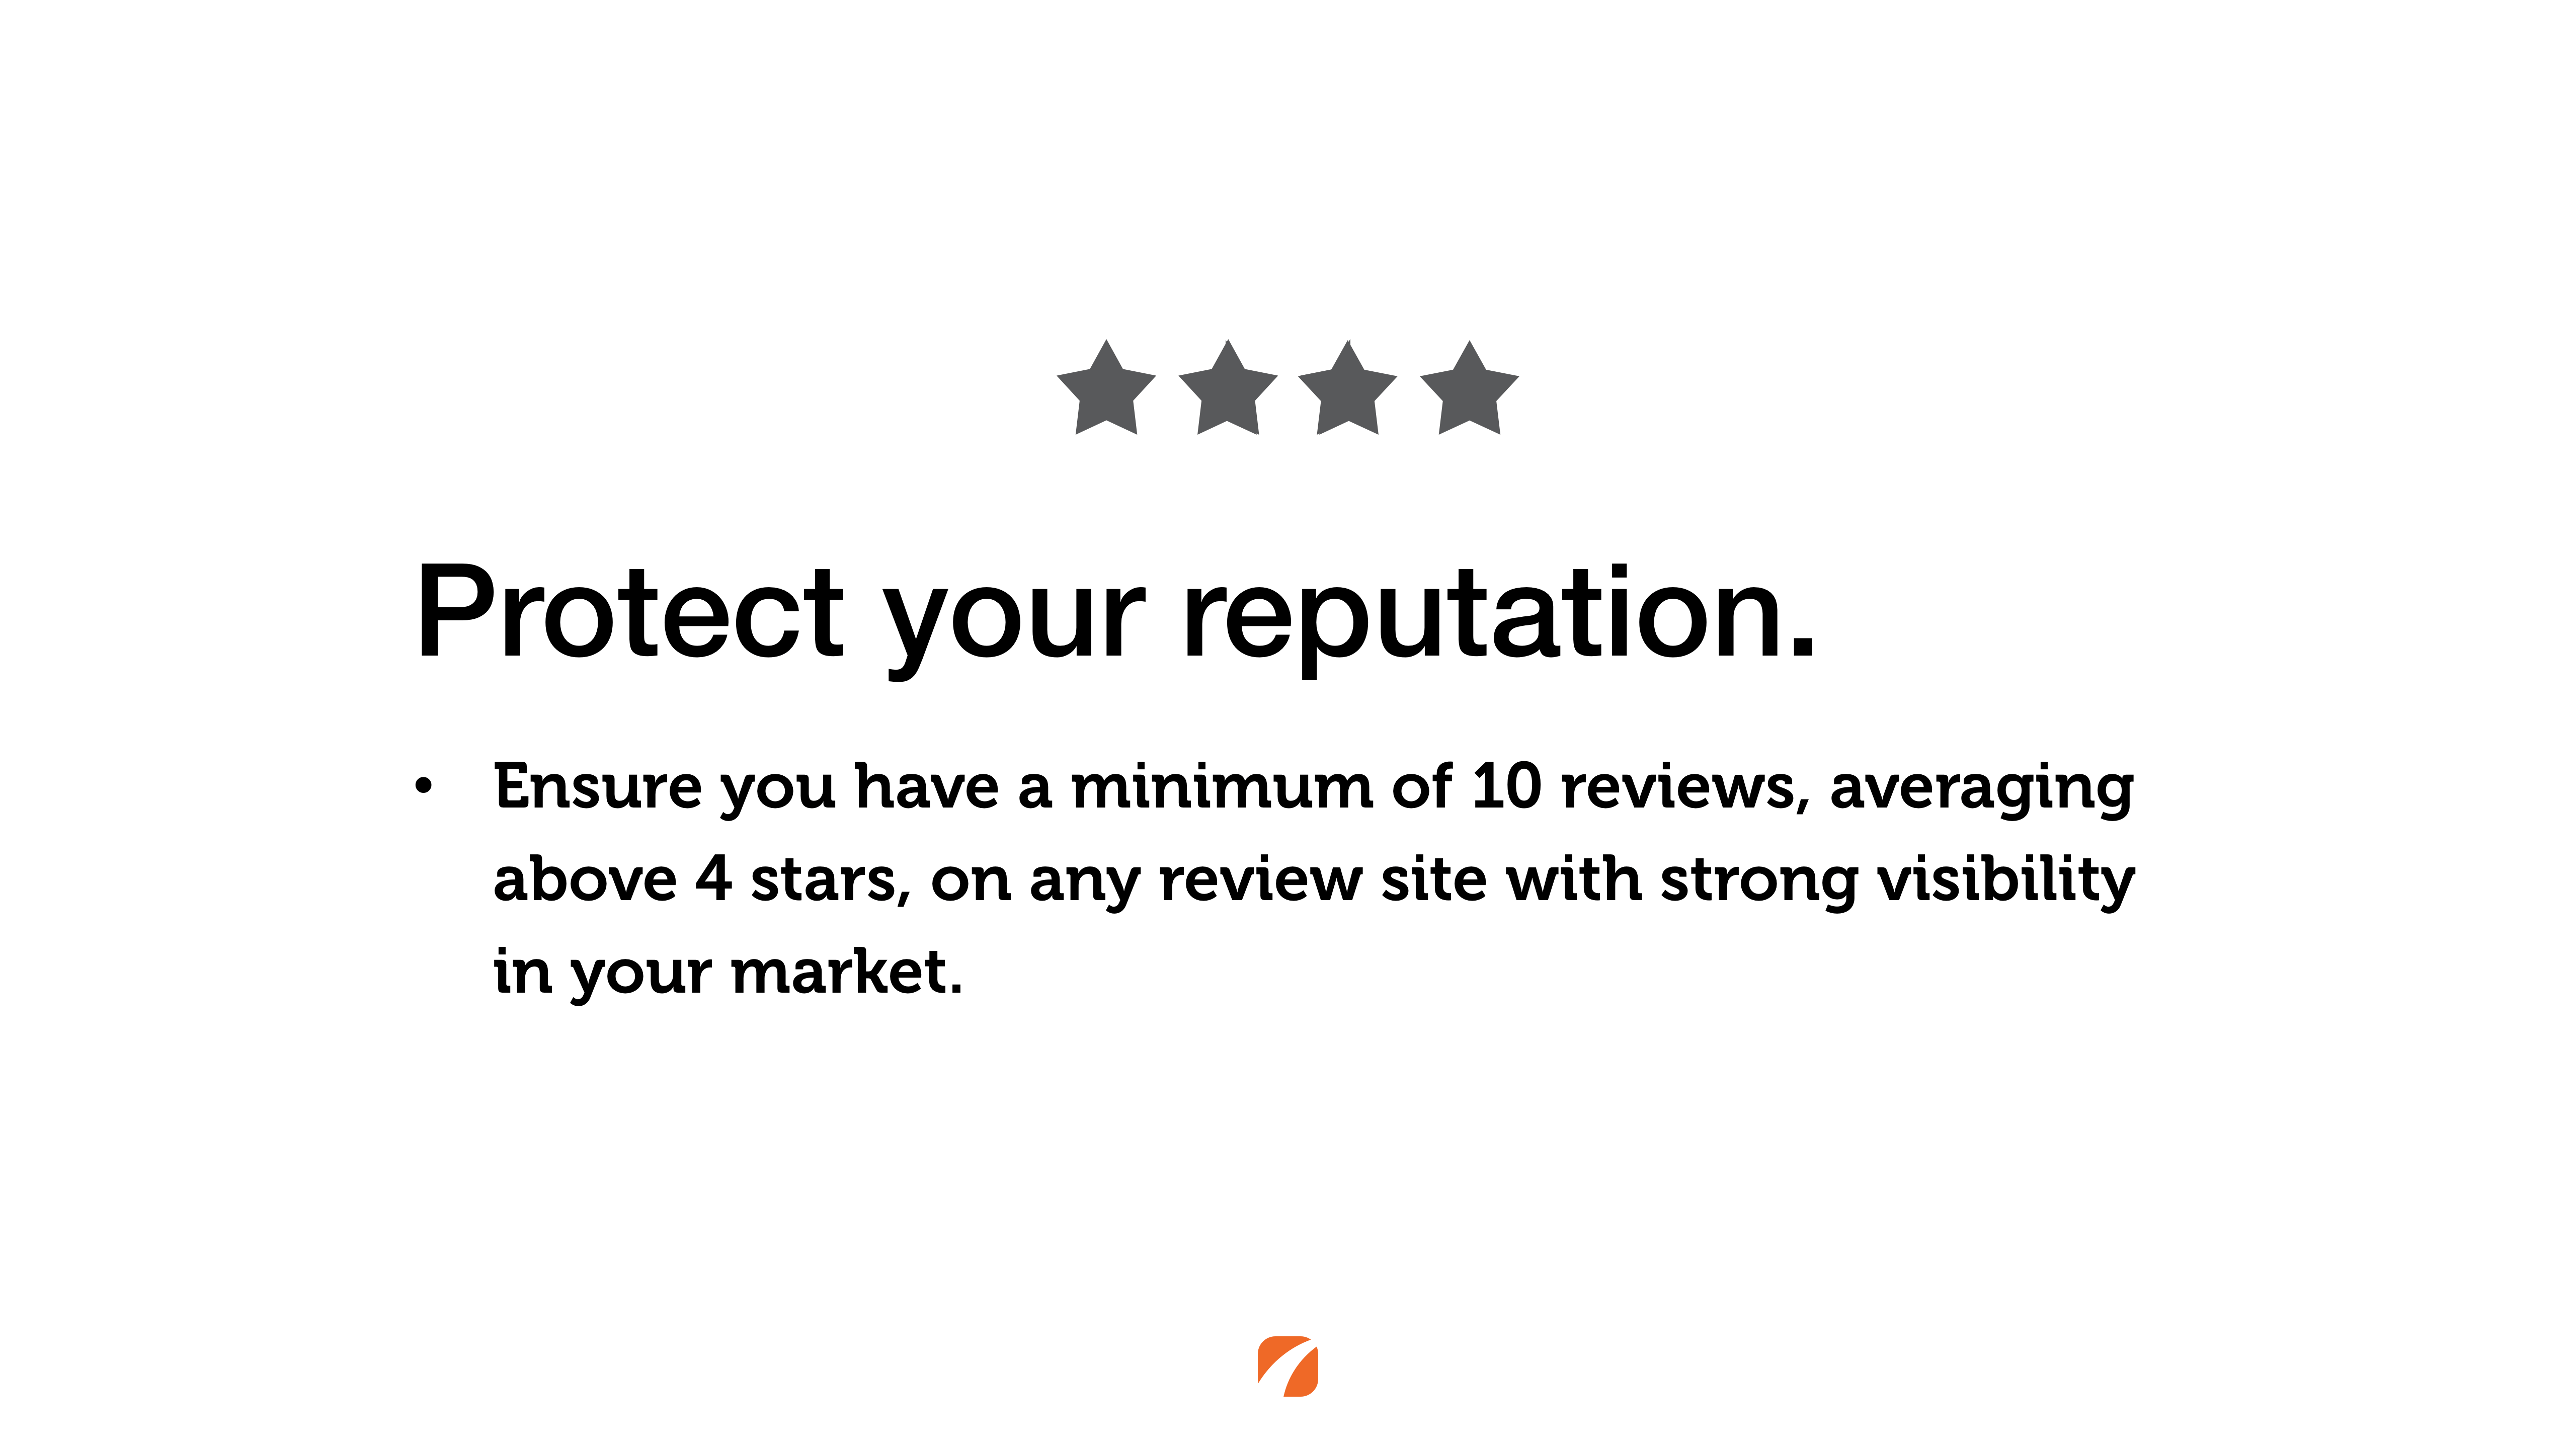
Now when we talk about reputation benchmarks in particular, what we want to look at are those sites that are the most visible in your market. These might be discoverable to you, actually you can go back and watch our very last newsletter topic on this issue, simply by searching for your medical specialty, so it might be ophthalmology, the city where you’re predominantly located or focused on, and then looking at which rating and review sites show up most often. Now we’re going to be concerned of course with sites like Google and Facebook, and in many markets it will be sites like Yelp, or medical sites like Healthgrades, RateMDs and Vitals. You’ll make a little list there and what you want to see is that you have at least 10 reviews, and at least 4 stars on those top five to ten rating and review sites that are most visible in your market, and if you don’t well that’s a sign to you as a leader that you need to focus effort and attention on your online reputation.
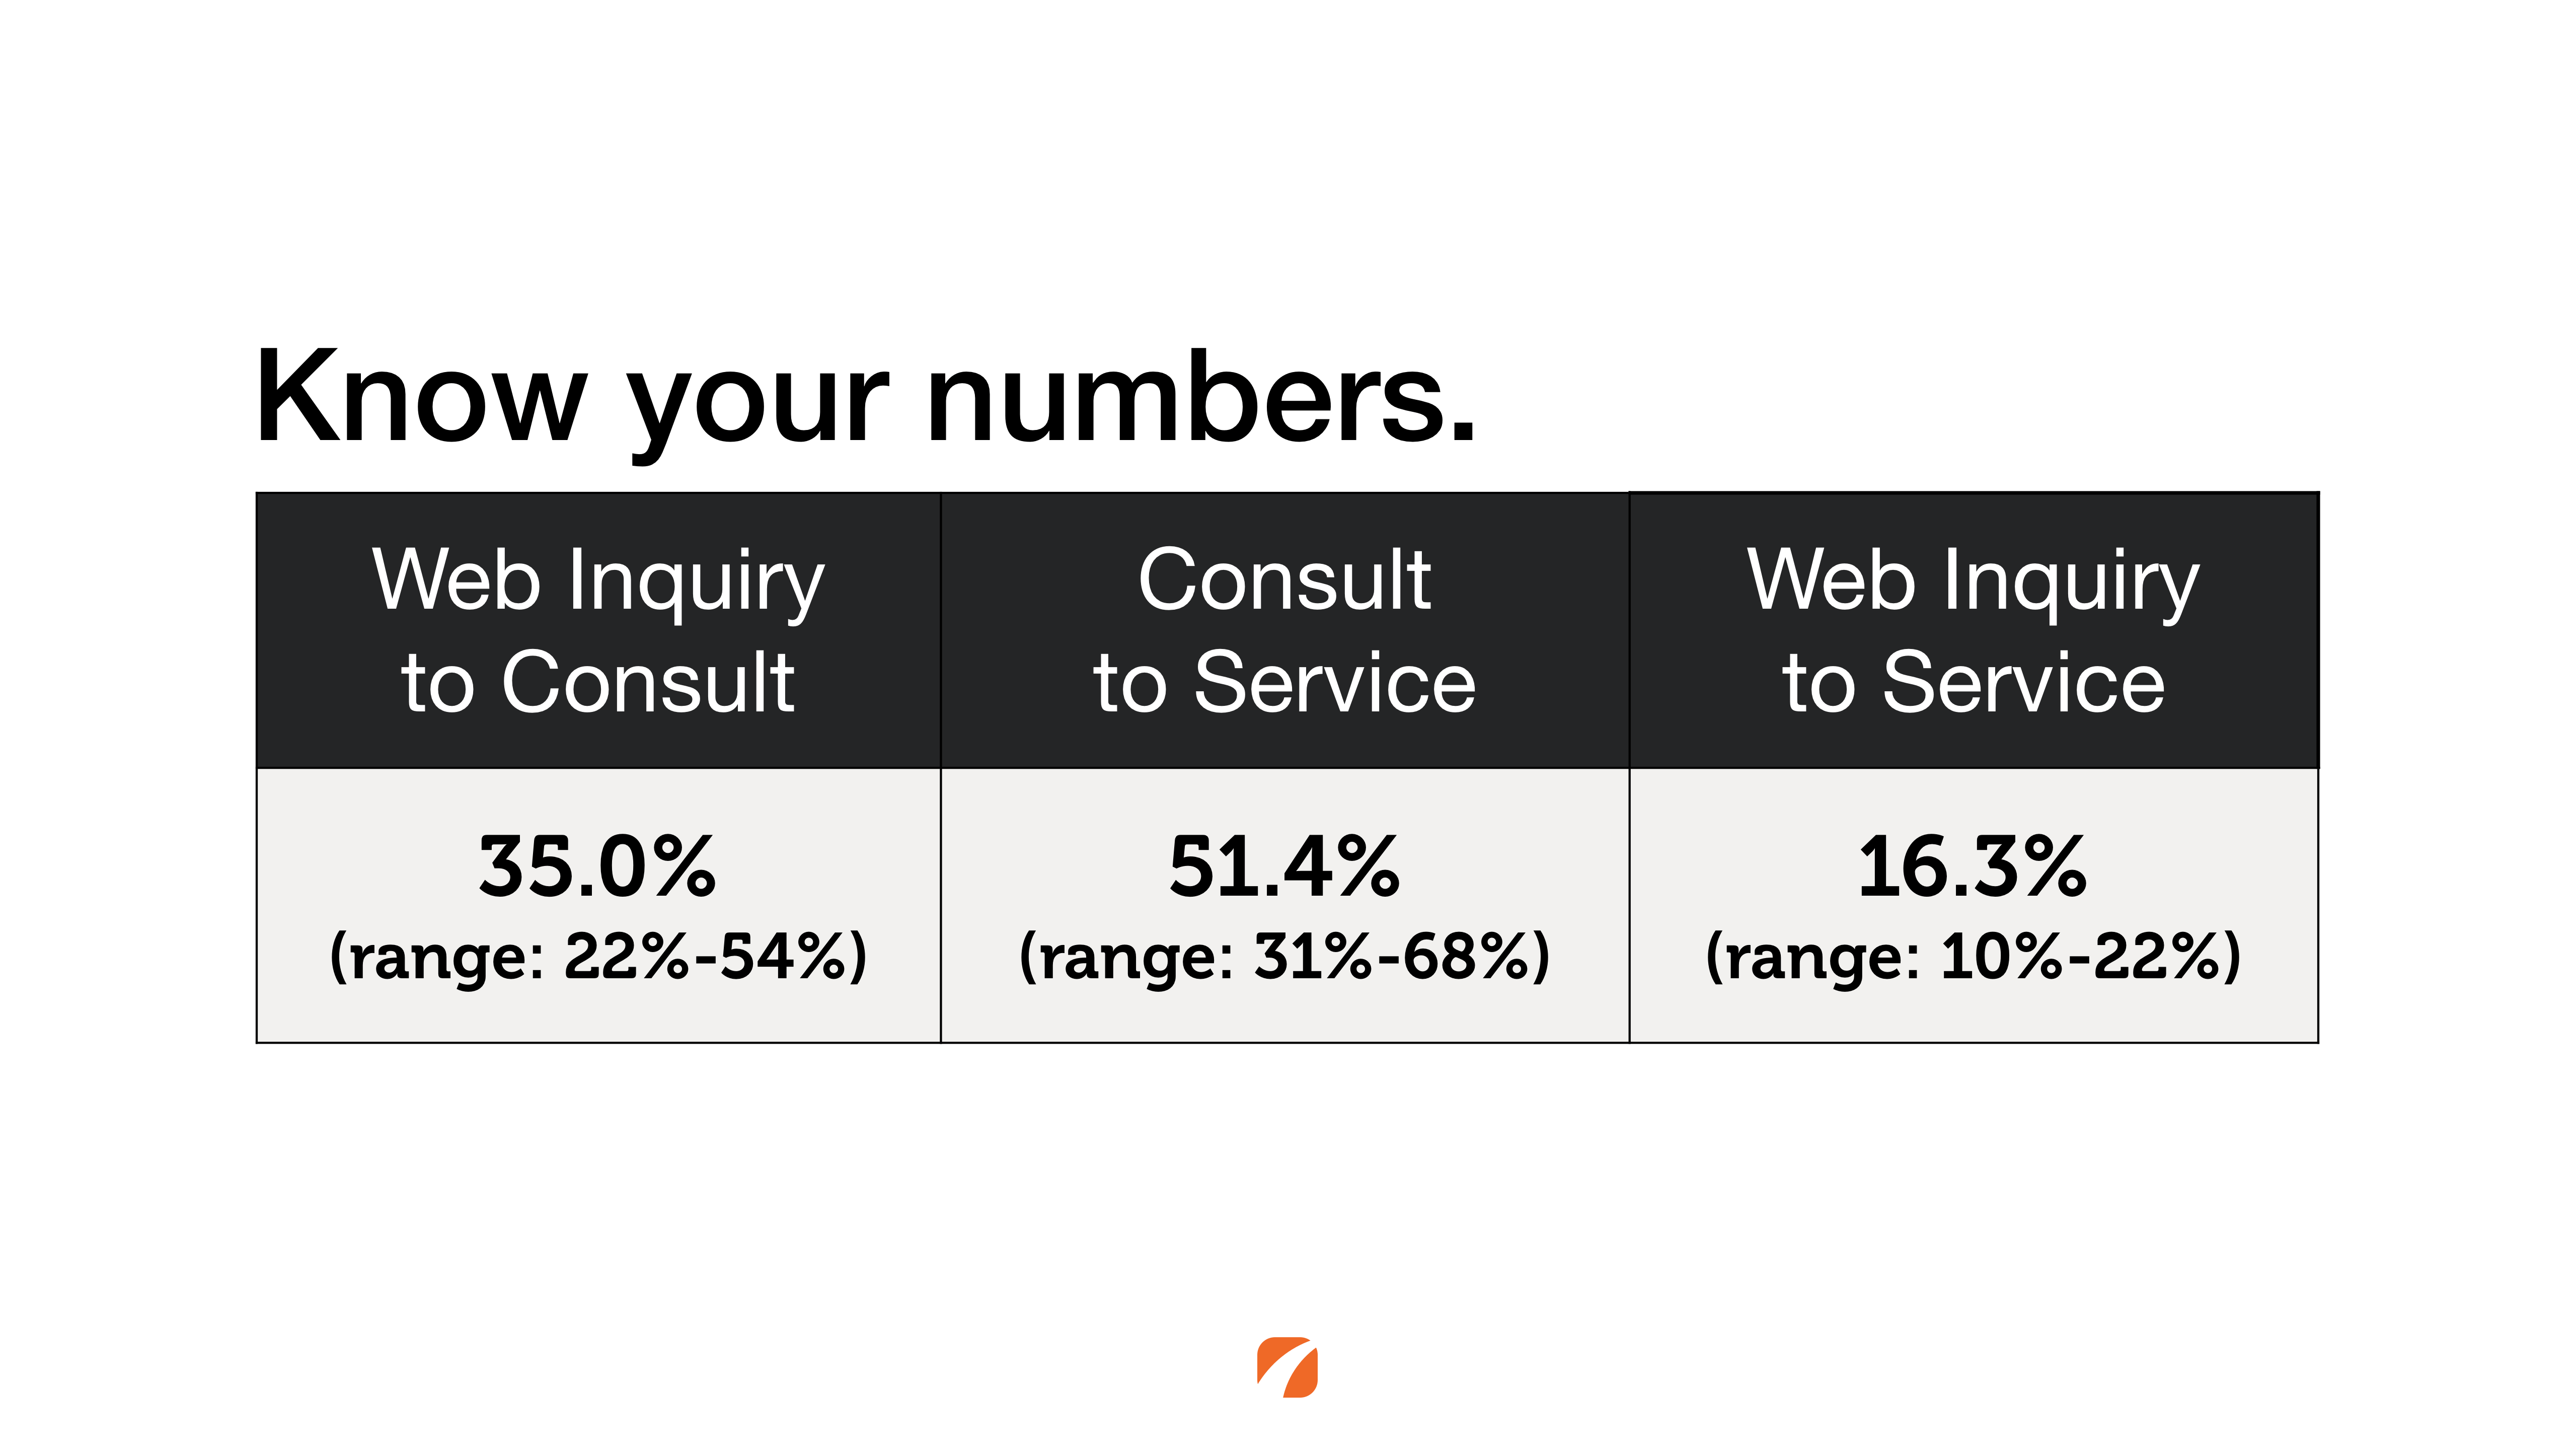
Now the last one here that we’re going to talk about today are your conversion benchmarks. Now these benchmarks in particular, I know we have viewers in many many different specialties but our largest sample is in the market of aesthetics, and what we’re going to look at here are the two key conversions: from inquiry to consultation, from consultation to paying procedure. And what we look at, is we look at on average about 35% of those web inquiries ultimately become consultations. Consultation to service is about a 51%. What we all know is that those web-based leads will sometimes convert less strongly than leads that are collected by something like word of mouth. And the aggregate conversion from web inquiry to service, well that’s at 16.3%.
Now how would you identify whether or not, or how you are converting? A simple test that you can do is to save all of the email leads that you receive in one month, to take all of the phone calls that you receive in one month and to log those, and at the end of the month keep a record of those inquiries if you don’t have more sophisticated software like our clients do, keep a record of those and audit. Identify where they are and how they progress through the sales cycle, and how much revenue is attached to each one of those opportunities. It’s going to tell you both your conversion at each one of those stages, and your return on investment for your online marketing overall.
Now we’ve developed a great tool, a fantastic guide that you can request online simply by completing the form that’s linked here. We’ll also provide the link in the email distribution and the blog post where you’re going to be able to watch this recording. Fill that out, download it, and it’s designed to help you as a practice leader ascertain where you’re doing well and where you need to focus some effort and attention for the future.
Of course if you have any questions about any of this, we invite you to give us an email. We wish you a very happy day.
Contact Us
Leave a Comment